

Marketing tips, news and more
Explore expert-backed articles on SEO, data, AI, and performance marketing. From strategic trends to hands-on tips, our blog delivers everything you need to grow smarter.

Local SEO - Location Targeted SEO
The internet is increasingly becoming a tool with a growing number of users and serving as a greater guide in our lives. Today, it's not just large corporations and holdings—small and local businesses also need websites and a presence on digital platforms.SEO services have long been utilized by large brands and businesses. However, as internet needs have become more widespread, digital marketing strategies like these have also become essential for small businesses. Now, services like SEO and digital advertising, with different strategies and focuses, have also become a focal point for SMEs.What is Local SEO?Local SEO, or Local Search Engine Optimization, refers to optimization efforts aimed at gaining visibility in a specific area or location. In other words, if your target audience for your business is located in a specific city or even district, Local SEO is exactly the service you need.To illustrate Local SEO, consider this: Suppose you're in the automotive sector and run a car repair business in Buca, İzmir. Unlike your competitors, you want to be visible online and gain leads or appointment requests from there. You’ve created your website, and now it’s time for SEO. Targeting the keyword “car repair” in your SEO strategy would be a poor approach. That’s because “car repair” is a broad, nationwide keyword. Showing up in search results for someone in Ardahan when you’re located in Buca is not strategic, as the likelihood of conversion is nearly zero. Also, “car repair” is a generic query—it might be searched for informational purposes. Even if you rank first in Turkey, you might not get any conversions if users are just curious about what car repair includes.That’s why, to ensure your digital investments and efforts convert faster, your target keywords should be something like “İzmir Car Repair” or “Buca Car Repair.” From these keywords, we understand that the user is directly seeking car repair services in a specific location. When you build your SEO strategies around these keywords, you’ll definitely see results. This is exactly what Local SEO is.Doesn't Google Already Show Results Based on User Location?Yes, Google and some other search engines have long been showing results based on users’ locations to improve user experience and deliver better results. However, developing location strategies is still the best approach to aim for higher conversions. Sites with fewer pages and limited brand recognition have a lower chance of ranking in broad geographic searches (like nationwide or global).Therefore, even if results are location-based, it's still essential to carry out additional Local SEO efforts.What Should Be Done for Local SEO and What Should You Pay Attention To?Local SEO is a strategy that enables businesses to optimize their digital presence in order to attract more customers in a specific geographic region and gain a competitive advantage in the local market. Here are some important steps and factors to consider for success in local SEO:Fully Utilize Your Google My Business AccountGoogle Maps and the Google My Business service are among the most important tools for users performing location-based searches. Today, users are searching for the most straightforward information in the fastest way possible. That’s why having your business listed in platforms like Google Maps is crucial for accessibility.Properly optimizing your Google My Business account and keeping the information accurate and up-to-date plays a major role. Be sure to add your website link, business hours, correct map location, phone number, and photos in detail. This will allow you to see strong performance in local SEO.Build Your Core Strategy Around Local KeywordsAs mentioned at the beginning of the article, focusing on local keywords can be more beneficial for you. Creating content based on relevant cities and locations can help you stand out. Additionally, you can structure your entire page with this approach. If you're working on a city-based strategy, the following details may help: Include the relevant location keyword in the URL path. For example, instead of www.examplesite.com/diesel-car-repair, use something like www.examplesite.com/izmir-diesel-car-repair. It may be beneficial to include the location keyword in your heading structure. Try incorporating the location when creating your content using proper heading order rules. Local targeting doesn’t mean there’s no competition or keyword volume. To select the right keywords, be sure to analyze your competitors. Include keywords with a Keyword Difficulty (KD) value between 0-20 and suitable search volume in your content. You can also use location-based anchors in your internal linking structure. This helps search engine bots better recognize the main keyword of the relevant page. Although Google sometimes auto-generates Meta Titles and Descriptions, it’s still important to carefully include your keywords here. There are two reasons for this: First, while most users use Google, others coming from different search engines (Yandex, Bing, etc.) will see these meta fields. Second, even for Google, since these fields are located in the site's head section, they are highly significant. So, use them wisely. Create a Mobile-Friendly WebsiteMost local searches are quick and performed via mobile devices. Moreover, since Google started prioritizing mobile experience in search results (MFI = Mobile First Indexing), this area has become extremely important. Whether you're running a large e-commerce site or a small service site, mobile compatibility plays a critical role. Don’t postpone these optimizations just because you have a few pages. Check your site speed and mobile responsiveness, then proceed with the necessary improvements without delay.Small Business = Big Digital GoalsNo matter the size of your business, thinking big is essential to achieving success in the digital world. You might be a small business, but growing your digital goals is the key to expanding beyond the local market. Local SEO strategies can increase your online visibility and help you connect more effectively with potential customers. Whether you're running a local café or own a small retail shop, expanding your digital goals gives you the opportunity to strengthen your online presence and build a closer relationship with your target audience. Remember, regardless of your business size, thinking big in the digital world is a crucial step toward real success.

Google Discover: More to Discover
Today, Google is one of the most preferred search engine bots. According to recent data, Google's usage rate worldwide is around 93.07%. The main reasons behind this popularity are its constant improvement, prioritization of user experience, and the ability to offer advanced data to website owners through free tools like Analytics, Tag Manager, Search Console, Looker Studio, etc. Although other search engines also provide similar tools (like Yandex Metrica), Google has not yielded its leadership flag to any competitor for years.One more service that Google has developed to improve itself and provide user-focused results is Google Discover! In this blog post, we’ll explain what Google Discover is and what you need to do to be featured in it. Enjoy your reading.What is Google Discover?Google Discover is a free service launched in September 2018 that offers user-focused search results. It presents useful, new, and up-to-date content based on a user's interests. The content shown is determined by the websites you visit, the news you click on, how long you stay on a page, and even your scroll behavior.Google’s goal with Discover is to allow users to access information from reliable sources on topics of interest without constantly needing to search in SERP.For example, let’s say you’re highly interested in computer games and constantly follow sales in that area. You spend time on sites like Steam and Epic Games or browse news sites that share game-related content. If Google Discover understands you're interested in "discounts" or "free games," it will directly show news from gaming sites in Discover, saving you from navigating the SERPs. This offers you a deeper and more personalized search experience.Why is Google Discover Important?Google Discover has significantly impacted SERP experience and search results. We can summarize its importance as follows: Personalized User Experience: Google Discover offers personalized content based on users’ interests and past behaviors even before they search. This helps users reach more relevant and valuable content faster. Increased User Loyalty: Discover consistently presents users with engaging and relevant content, increasing loyalty as users return regularly for updates. Like Instagram’s or TikTok’s explore page, it encourages discovery and reading. Organic Traffic Growth: Being featured in Google Discover can increase organic traffic. With the right optimization and content strategy, your website can appear frequently in Discover, boosting your visitor numbers. Brand Awareness and Promotion: Discover enables brands and content providers to reach broader audiences. If your content is high-quality and engaging, your brand visibility will increase, along with your chances of reaching new users. Trend Monitoring and Quick Reaction: Google Discover allows for rapid monitoring of current and trending topics, enabling content creators to quickly adapt and produce relevant content. Optimized for Mobile Users: Discover is optimized for mobile use. It offers a better experience for mobile users and focuses on fast loading times. Enhancing SEO Strategies: Discover is not just about traditional search results but also includes interest-based content, providing opportunities to expand and diversify SEO strategies. Can Google Discover Increase Our Traffic?Yes, Google Discover directly affects your Search Console data. The impressions and clicks gained through this channel count as organic. We can say that Google Discover is highly beneficial and necessary for SEO strategies.Moreover, traffic from Discover is highly valuable because it’s based on the user’s interest, not a spontaneous search. This can help users become familiar with your site, increase brand awareness, and eventually lead them to return directly via “Direct” traffic. In short, we can say that Discover traffic tends to be more conversion-focused and fosters customer loyalty.What Should Be Done to Be Featured in Google Discover?We’ve understood what Google Discover is and why it matters. We know it affects both our traffic and customer loyalty. But what do we need to do to be included in Google Discover?You can access Google’s official article on the topic here. In summary, here are the key points to focus on to be featured in Discover: Use original, descriptive titles that represent the content accurately and avoid clickbait. Your images must be engaging. Do not include your logo in them. Your images must be high-quality. Use large images—at least 1200px wide—with the setting max-image-preview:large or use AMP. Avoid topics related to erotica, gambling, or content that promotes anger. These can prevent your inclusion in Discover for a long time. This applies not only to text but also to visuals and videos. Including explanatory images and videos can help show your content is valuable and informative. Is Google Discover Only for News Outlets (Sites Registered as News)?Google Discover often features news sites, but the answer is no—it is not exclusive to registered news outlets or news sites. Blogs and websites on various topics and interests can also appear here. The important thing is meeting Google’s content criteria.News websites often appear more frequently because they can publish timely content across various topics. However, being registered as a news site is not a required metric to appear in Discover.Where Can We See Google Discover Data in Search Console?As mentioned earlier, traffic from Google Discover counts as organic. Therefore, the impressions and clicks gained from this area can be seen in Google Search Console.You can quickly access the impressions and clicks obtained from Discover through the left sidebar in Search Console. In the Performance section, right below Search Results, you’ll find the Discover tab. By clicking it, you can see the date ranges you were featured, which pages appeared, and which countries your traffic came from.
What is Orphan Page? How to Detect?
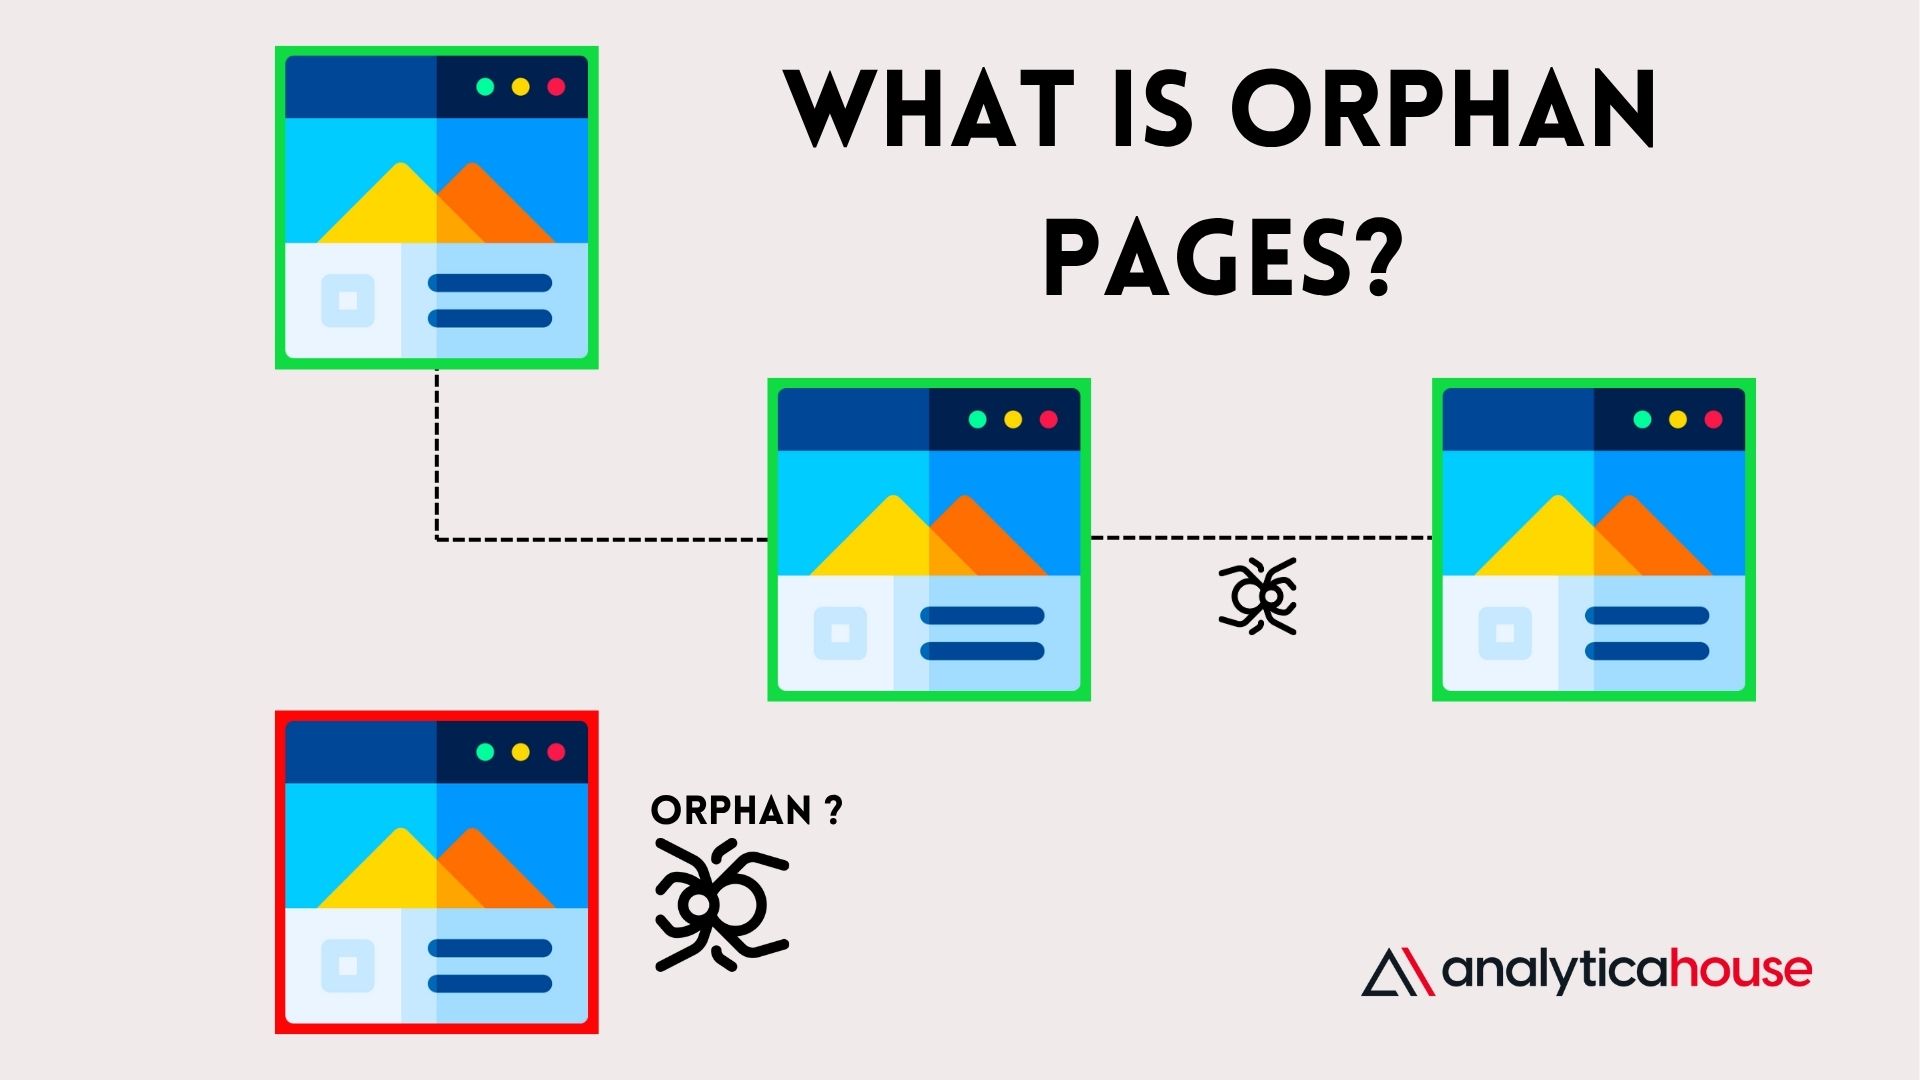
The Orphan Page error is one of the issues you may encounter in the field of SEO. While it's a significant problem, it is a type of issue that can be detected and resolved quickly and easily. Especially if you come across this error using tools like Screaming Frog or Ahrefs, there's no need to worry—because the solution is fairly simple.Internal linking and link building are highly important for SEO on our websites. For search engine bots to crawl and discover your page faster, seeing a link within the site is crucial. The Orphan Page error means that a page on your website is not linked from any other internal page. In other words, the URL flagged as an orphan page is not receiving any internal links—making it "orphaned."Are Orphan Pages Harmful for SEO?Yes, orphan pages are a negative factor for SEO. When no links point to a given URL, search engines have a hard time finding it. Unfound pages cannot be indexed, which negatively impacts your organic traffic.Search engines discover and index content by following the structural links of a website. Since orphan pages can’t be discovered via internal links, their content may be ignored or left unindexed by search engines. This significantly reduces the chances of those pages appearing in search results. Additionally, the lack of internal links prevents the page from gaining authority and trust from internal and external link signals. Therefore, orphan pages negatively affect SEO performance, and identifying and properly integrating them into the site structure is essential to improving site-wide search engine visibility and user experience.What’s the Solution to an Orphan Page?The solution to orphan pages is quite simple. Linking to the orphan page from another internal page will resolve the issue. However, it is important to use relevant anchor text rather than inserting random links. A random link might eliminate the "orphan page" error on paper, but it could harm your SEO performance. That’s why building meaningful links with accurate and relevant anchor texts is important.Can a URL in the Sitemap Still Be an Orphan Page?Sitemaps, which are crucial for SEO, are one of the most important files that contain the link structure of a site and guide search engine bots. So, does being listed in the sitemap remove a page from orphan status?Yes, having any URL listed in the sitemap removes that page from orphan status. In fact, this is the easiest way to resolve an orphan page error. The most important step you can take for an orphan page is first adding it to the sitemap and then, if necessary, adding internal links. A page flagged as an orphan page will likely also throw a "URL is not in sitemap" error, which is another critical issue.How Can You Detect Orphan Pages?There are several ways to identify orphan pages. Some tools used by every SEO specialist can easily detect orphan pages. Here are some tools that help detect orphan pages:Screaming FrogAhrefsWith these tools, you can quickly identify orphan pages on your site and take immediate action.Detecting Orphan Pages with AhrefsAhrefs is one of the essential tools in an SEO expert’s toolkit. It helps you manage both on-page and off-page SEO activities. It’s also a fantastic tool for keyword research.In the on-page SEO section, you can detect many issues like 404 errors, redirect chains, duplicate content, and more. One of the issues it can detect is orphan pages. Let’s look at how to identify orphan pages using Ahrefs:First, you need to add your site as a project in Ahrefs to detect orphan pages. Once you’ve done that, go to the Site Audit section from the Tool Bar. Then select your project from the Site Audit section. In the opened dashboard (as shown in the screenshot above), the orphan page error is typically listed by default. But if it’s not, you can easily access it from either the All Issues or Bulk Export section.When you click on Bulk Export, you’ll see the orphan page section under the URL Issues part. You can view it directly on the panel or export the data as a CSV file.To summarize, here’s how to identify orphan pages with Ahrefs: Log into Ahrefs. Add your site as a project. After crawling completes, click on the Site Audit section. Navigate to Bulk Export. View orphan page errors either on the panel or via CSV export. Detecting Orphan Pages with Screaming FrogScreaming Frog is one of the most detailed tools for conducting technical SEO analyses. It scans each URL of your website individually and provides extensive results, making it easy to detect orphan pages.As shown in the example above, first open Screaming Frog and go to Configuration > Spider > Crawl. Then go to the XML Sitemaps tab and follow these steps: Check the "Crawl Linked XML" option. Check "Crawl These Sitemaps." Enter your site’s sitemap in the box provided. Click OK. Next, you’ll need to perform a regular crawl of your site. Click Start and wait for the crawl to finish before proceeding to the next step.Once crawling is complete, go to the top menu and select Crawl Analysis, then click Start. This will trigger a scan of the part of your site we defined earlier via the sitemap, much like an API process.After initiating Crawl Analysis, wait for the process to reach 100% completion. Once finished, go to the Sitemap section in Screaming Frog’s navigation panel. If this section hasn’t been connected previously, it may not be marked as clickable, so be sure to check this area.Finally, once in the Sitemap section, you can view your orphan pages either from the filter area on the left or the Overview panel on the right.To summarize, here’s how to detect orphan pages using Screaming Frog: Open Screaming Frog and go to Configuration > Spider > Crawl. In the popup window, go to the XML Sitemaps section. Select "Crawl Linked XML" and "Crawl These Sitemaps." Enter your site’s sitemap and click OK. Run a normal crawl of your site on the dashboard. After crawling, go to the top menu and start Crawl Analysis. Wait for the analysis to complete. When done, select the Sitemaps section. You can now view your orphan pages here.
A Dive into Prompt Engineering Techniques Pt.2
Welcome back to "A Dive into Prompt Engineering Pt.2," where we continue our exploration of the fascinating world of prompt engineering techniques. In the first part, we delved into the foundational concepts and some intriguing prompt techniques. Now, we're taking a step further to uncover more advanced strategies. This journey is not just about learning how to interact with AI like ChatGPT; it’s about mastering a unique language that combines human chain of thought with AI's immense capabilities. As we dive deeper, we'll discover how these techniques can enhance storytelling, decision-making, and even our understanding of AI itself. So, let's continue our adventure into the intricate art of ChatGPT prompt techniques and ChatGPT prompting techniques.The Strength of Prompt PatternsIn this part of our series, we focus on the power and versatility of various prompt patterns. Each pattern represents a unique approach to engaging with ChatGPT, offering distinct advantages depending on the scenario. From the Reflection Pattern, which deepens our understanding of AI responses, to the creative flair added by the Persona Pattern, these techniques are invaluable tools in the arsenal of anyone keen to enhance their AI interactions. Image: Personal archive, generated by DALL-EWhether you're using ChatGPT prompts for storytelling techniques or seeking to refine your questions, understanding these patterns is key to becoming a proficient prompt engineer. Let's explore these patterns and see how they can transform our conversations with AI into more productive and creative experiences.Reflection PatternThe Reflection Pattern is like giving ChatGPT a mirror, allowing it to introspect and explain its thought process. This pattern is a gem in prompt engineering, especially for those curious about the 'why' behind an AI's response. Imagine asking ChatGPT not just for an answer, but also for the rationale behind it. For instance, "What factors make renewable energy important, and can you explain your reasoning?" The AI not only provides the answer but also delves into its reasoning. This pattern is invaluable for educational purposes, offering a deeper understanding of AI logic.Image: Personal archive, generated by ChatGPTIn this example, the user employs the Reflection Pattern by asking for not just information, but also the reasoning behind it. And as you see, this pattern enhances the depth of AI interactions, encouraging ChatGPT to provide not just answers but also the thought process behind them.Refusal Breaker PatternThe Refusal Breaker Pattern is a clever twist in prompt engineering where AI, instead of hitting a dead end, provides insights into its limitations and suggests alternative approaches. This pattern comes into play when AI can't directly answer a question. Here’s what it looks like:Image: Personal archive, generated by ChatGPTThis pattern ensures that the conversation doesn’t come to an abrupt stop due to the AI's inability to answer. It guides the user towards a permissible line of questioning, maintaining the flow and productivity of the interaction. It's a valuable strategy in effective prompt engineering, demonstrating how to navigate around AI's limitations gracefully.Context Manager PatternIn the Context Manager Pattern, it’s all about directing the AI’s attention to ensure its responses are relevant and focused. This pattern empowers you to specify or exclude certain topics to guide ChatGPT's responses. It’s a strategic move in prompt engineering, especially useful when discussions could easily stray into unrelated areas. By clarifying the context, such as emphasizing a particular scope or asking to disregard certain aspects, you can keep the conversation sharp and on point, ensuring that ChatGPT remains aligned with the desired topic or angle.Image: Personal archive, generated by ChatGPTRecipe PatternThe Recipe Pattern in prompt engineering is akin to giving ChatGPT a cookbook of instructions. This pattern involves crafting step-by-step guides or procedures for the AI to follow, ensuring a structured and methodical response.I t’s a valuable tool for structuring information in a coherent and practical manner, turning complex tasks into simple, digestible steps. Basically, asking ChatGPT for a step-by-step manual is an example of the usage of the recipe pattern, whether it be an actual recipe or a how-to guide.Image: Personal archive, generated by ChatGPTIn this scenario, the user employs the Recipe Pattern by asking for sequential guides on specific tasks. The first request is for a step-by-step guide on market research, and the second is for a checklist for a digital marketing campaign.Persona PatternThe Persona Pattern transforms ChatGPT into a character, enabling dynamic and diverse interactions. In this approach, you assign ChatGPT a specific persona or role, like a historical figure, a fictional character, or a professional expert, and interact accordingly. It’s an engaging way to explore different perspectives and narratives, making interactions with ChatGPT more vivid and imaginative. It looks like this:Image: Personal archive, generated by ChatGPTQuestion Refinement PatternThe Question Refinement Pattern in prompt engineering is like having a skilled editor for your queries, ensuring ChatGPT understands and addresses the heart of your questions. This pattern helps refine broad or unclear questions into more precise and focused ones. Image: Personal archive, generated by ChatGPTWhen you pose a question, ChatGPT might suggest a more specific or better-structured version. This not only fine-tunes the query for more accurate answers but also aids in exploring complex topics thoroughly. It's particularly beneficial in research and learning scenarios, where the nuances of how a question is framed can dramatically alter the information received.Alternative Approach PatternThe Alternative Approach Pattern in prompt engineering introduces a realm of possibilities, encouraging ChatGPT to offer different perspectives or solutions. Instead of a single answer, this pattern prompts the AI to explore a range of options or viewpoints.Image: Personal archive, generated by ChatGPTFor instance, when faced with a problem or decision, you can ask ChatGPT to present various approaches or outcomes. It’s like having a brainstorming session where multiple paths are laid out for consideration. This pattern is invaluable for decision-making, problem-solving, and creative thinking, offering a broader perspective and fostering a more comprehensive understanding of the topic at hand.Cognitive Verifier PatternThe Cognitive Verifier Pattern ensures responses are not just quick but also well-considered and accurate. When faced with a question, this pattern prompts ChatGPT to generate additional, related questions that delve deeper into the topic.Image: Personal archive, Generated by ChatGPTIn this scenario, ChatGPT uses the Cognitive Verifier Pattern by generating additional questions to more thoroughly address the user's query about reducing urban air pollution. Instead of giving a direct answer, it first identifies key sub-questions that explore the causes, successful methods in other contexts, and potential barriers to these methods. As we've journeyed through the fascinating world of prompt engineering, guided by the insights of Jules White and colleagues, it's clear that this field is not just about interacting with AI; it's about mastering a language that bridges human creativity and AI potential. Each pattern we've explored offers unique ways to enhance and direct our conversations with ChatGPT, making every interaction more meaningful, productive, and enjoyable. Whether you're a seasoned AI enthusiast or just starting out, the art of prompt engineering opens up a realm of possibilities, inviting you to shape the future of AI communication. So keep experimenting, keep learning, and most importantly, keep having fun with AI!
A Dive into Prompt Engineering Techniques Pt.1
Diving into the world of AI, one skill truly stands out: prompt engineering. It's like having a secret key to unlock the full potential of large language models like ChatGPT. Think of it as being a bit like a prompt engineer, crafting clever cues to guide these AI geniuses. Picture this: You're not just asking questions; you're setting the stage for a grand performance where AI is the star!Now, there's this fascinating paper by Jules White and pals. It’s not just another academic read; it’s a treasure trove for anyone intrigued by prompt techniques and looking to jazz up their conversations with AI. Whether you’re eyeing AI writer jobs, dreaming up ChatGPT prompts for storytelling techniques, or just curious about what is prompt engineering, this paper's got some cool tricks up its sleeve. It’s like having a backstage pass to the show of AI communication!This is why this blog focuses on some of the prompt patterns identified by White et. al in “A Prompt Pattern Catalog to Enhance Prompt Engineering with ChatGPT”. We believe the classification established in this paper is very convenient and explanatory, and also easy to grasp for even beginner prompters! So, feel free to further your research by delving into the article itself.Before we dig deeper, we want to offer special thanks to Jules White and colleagues for their work and making this valuable information available.Now buckle up and get ready to learn many tricks without enabling any plugins.The Essence of Prompt PatternsEver wondered what makes talking to AI like ChatGPT so fascinating? The secret sauce is prompt patterns! These nifty tools are not just a bunch of different prompts strung together; they're the magic spells that turn AI chats from blah to brilliant.So, what exactly are these patterns? As White et al. (2023) articulate, 'Prompt patterns are a knowledge transfer method analogous to software patterns since they provide reusable solutions to common problems faced in a particular context' (p. 2). To put it simply, imagine you're a chef. Instead of spices, you've got prompt techniques at your disposal. Each pattern is like a unique recipe, tweaking how ChatGPT responds. Whether you're in a serious prompt engineering course or just messing around for fun, these patterns are your best pals.Why are they so crucial? Well, they're the difference between getting a yawn-worthy answer and sparking an AI conversation that's as lively as a dance party. It’s all about hitting the right notes and making AI interactions not just informative but also super engaging. And let's face it, who doesn't want to be the life of the AI party?In the world of prompt engineering, these patterns are your toolkit to success. They’re what every AI prompt engineer dreams of mastering. From crafting ChatGPT prompting techniques to exploring prompt engineering examples, understanding prompt patterns is like learning the language of AI fluency.Decoding the CatalogLet's crack open the "Prompt Pattern Catalog" from Jules White and team’s insightful paper. It's like a treasure map for prompt engineering, full of hidden gems waiting to be discovered. This catalog isn’t just a list; it’s the Rosetta Stone for AI prompt engineers.In the wise words of the authors, "A prompt is a set of instructions provided to an LLM that programs the LLM by customizing it and/or enhancing or refining its capabilities" (White et al., 2023). This means every prompt you craft is like a secret code, instructing ChatGPT to perform feats of AI wizardry.They also reveal, "Prompt patterns are essential to effective prompt engineering" (White et al., 2023). That's right, these patterns aren't just cool tricks; they're the backbone of any good AI writer job or prompt engineering job. Whether it's for ChatGPT prompt techniques or chain of thought explorations, these patterns are the keys to a kingdom of endless AI possibilities.Image: Personal archive, generated by DALL-EThey also reveal, "Prompt patterns are essential to effective prompt engineering" (White et al., 2023). That's right, these patterns aren't just cool tricks; they're the backbone of any good AI writer job or prompt engineering job. Whether it's for ChatGPT prompt techniques or chain of thought explorations, these patterns are the keys to a kingdom of endless AI possibilities.Meta Language Creation PatternNow, onto the intriguing Meta Language Creation Pattern. This is where things get really fun in the world of prompt engineering. It’s about creating a whole new language for AI to understand. Imagine you're a linguist crafting a secret dialect only you and ChatGPT know!According to the paper, "The key structure of this pattern involves explaining the meaning of one or more symbols, words, or statements to the LLM" (White et al., 2023). It's like teaching ChatGPT a secret handshake. Whether for AI writer jobs or just for kicks, this pattern opens up a world where you and AI speak a private language. It's not just about communication; it's about connection.Image: Personal archive, generated by ChatGPTIn this example, the user introduces a custom term, "Starlight", as a shorthand for a specific topic of interest – space exploration and astronomy. This is an instance of the Meta Language Creation Pattern in prompt engineering. The user effectively programs ChatGPT to associate the term "Starlight" with a broad topic, enabling more concise future prompts. When the user later mentions "Starlight updates", ChatGPT understands it as a request for the latest news in space exploration.Output Automator PatternThe Output Automator Pattern is like having a personal AI assistant to handle the grunt work. This pattern is all about making ChatGPT do the heavy lifting by automating outputs. Think of it as setting up a mini-factory inside ChatGPT where the cogs and wheels are your instructions.As the paper puts it, "The intent of this pattern is to have the LLM generate a script or other automation artifact" (White et al., 2023). Whether it’s for crafting ChatGPT prompting techniques or simplifying repetitive tasks in AI writer jobs, this pattern is a game-changer. It transforms complex, multi-step tasks into simple, single commands, making your life as a prompt engineer a breeze.Image: Personal archive, generated by ChatGPTIn this example, the user leverages the Output Automator Pattern by requesting ChatGPT to create a script that performs a specific, repetitive task: compiling and summarizing research articles. This pattern transforms ChatGPT from a mere conversational partner into a powerful tool that automates complex tasks.Visualization Generator PatternAs laid out in the paper, “The intent of this pattern is to use text generation to create visualizations” (White et al., 2023). It’s basically using the output (response) of ChatGPT as an input (prompt) for image generator models like DALL-E or Midjourney. Very simple yet effective:Image: Personal archive, generated by ChatGPTIn this instance, the user is utilizing the Visualization Generator Pattern by asking ChatGPT to formulate a specific prompt for a visual AI generator like DALL-E or MidJourney. This pattern is about transforming a concept or idea into a detailed, descriptive prompt suitable for creating visual art.By employing this pattern, the user effectively leverages ChatGPT's linguistic abilities to direct a visual AI, showcasing an advanced application of prompt techniques in a cross-disciplinary AI collaboration.Game Play PatternThe Game Play Pattern brings a dash of fun to prompt engineering, turning interactions with ChatGPT into an entertaining game. It's like being a game master, with ChatGPT as your eager player.Imagine designing a trivia game or a text-based adventure where ChatGPT comes up with challenges or storylines. This pattern is perfect for creating interactive experiences, whether for educational purposes in prompt engineering courses or just for a bit of playful banter. Here’s an example:Image: Personal archive, generated by ChatGPTBy using this pattern, you can transform a standard Q&A session into a dynamic game, showcasing the versatility of AI in both learning and leisure contexts. It’s a testament to how prompt techniques can not only inform but also entertain.As we wrap up this first part of our exploration into the world of prompt engineering, it's clear that the techniques and patterns we've discovered are not just tools, but gateways to unlocking the full potential of AI interactions. From creating new languages to automating tasks and generating visual prompts, the possibilities are as vast as they are exciting. Each pattern we've discussed offers a unique way to enhance and guide our conversations with AI, making every interaction more meaningful and impactful.Image: Personal archive, generated by DALL-EBut our journey doesn't end here. In "A Dive into Prompt Engineering Techniques Pt.2", we'll dive even deeper into the treasure trove of prompt patterns. We'll explore more innovative techniques that further refine our interactions with AI, pushing the boundaries of what's possible in the realm of prompt engineering. Let's continue to learn, experiment, and discover the art of prompt engineering together in the next part of our series.

Key Steps of Our Black Friday Success
Have you ever wondered about how AnalyticaHouse consistently succeeds on Black Friday? Here's a breakdown of the steps our teams take to make sure Black Friday is a prosperous day for us.Getting Ready for the Sale: The 80% RuleWe strongly believe that the key to doing well in big sales events is getting ready beforehand, which accounts for about 80% of the effort. So, what are the important things we focus on when getting ready for the big day? What are the things we can't afford to overlook? Here are the major steps we take:The Basics: Accurate MeasurementFirst off, accurate measurement is essential. It's not just about keeping an eye on things; it's about giving our systems the right information they need to work effectively. Think of it like the difference between randomly trying to catch fish in the sea and fishing in a pond where you know the fish are.Ready, Set, Go: Checking if We're PreparedNext, we need to make sure we're prepared. Do we have enough of the things people want to buy? Are we selling what people are looking for? Is our website ready for the extra people visiting it on Black Friday? Have we told our customers about any possible issues, like if things might take longer to ship? We need to be sure about these things before we start.Advertising and Strategy: Making Plans and Being SmartWe also can't forget about our plans and how we're going to tell people about our products. Are our ads clear and interesting? Have we worked with the right places to let people know about our sale? Do we know where our customers are online, and are we reaching out to them there? And, of course, have we got our special offers and reminders ready? We've got to plan all of this in advance.Putting it All Together: The Recipe for SuccessOver time, we've seen that when we get all these things right, our sales go up a lot on Black Friday. So, here's to a great sales season for everyone!