

Marketing tips, news and more
Explore expert-backed articles on SEO, data, AI, and performance marketing. From strategic trends to hands-on tips, our blog delivers everything you need to grow smarter.

Promising Predictions of Black Friday and Cyber Monday 2023
As Black Friday draws near this year, the excitement and anticipation are running high, much like in previous years. Our team's successful management of advertising campaigns last year has set the bar high for our expectations this time around.Impressive Results from Last YearIn the previous year, we achieved exceptional results, with a remarkable 208% increase in revenue and a significant 40% boost in sales when compared to the previous year. We gathered this data by analyzing the performance of our Black Friday campaigns across five different e-commerce platforms. These achievements stand as a testament to our ability to adapt and grow, even in the face of challenges.Predicting Changes in OpportunitiesLooking ahead to this year, we foresee a shift in the landscape that may present even more promising opportunities compared to the previous November. Some brands and marketplaces are expected to reduce their Black Friday investments, which could lead to a more level playing field and increased expectations for us.Critical Preparations for SuccessIn the world of digital marketing, success hinges on meticulous planning and seamless execution. To ensure a smooth journey from campaign setup to the November launch, thorough preparations are essential. This involves paying close attention to every detail, with a particular focus on elements that have a significant impact. To set the stage for success, it's highly advantageous to have preparations such as measurements, campaign setups, media ad bookings, and content editing well in advance, ideally several months before the big day. This approach simplifies tasks and allows us to focus our efforts when the crucial November period arrives.A Positive Outlook for the FutureWith these preparations in place, the outlook for this year appears highly promising. We could potentially witness a doubling of our sales and a four- to five-fold increase in revenue. It's important to note that these estimations are optimistic and the actual results may exceed them significantly. Factors like our product range, inventory depth, and brand visibility will play crucial roles in determining the final outcome. These estimations provide a general overview, and the real results could surpass them even more substantially. ?
Topic Clustering, a Core Content Strategy
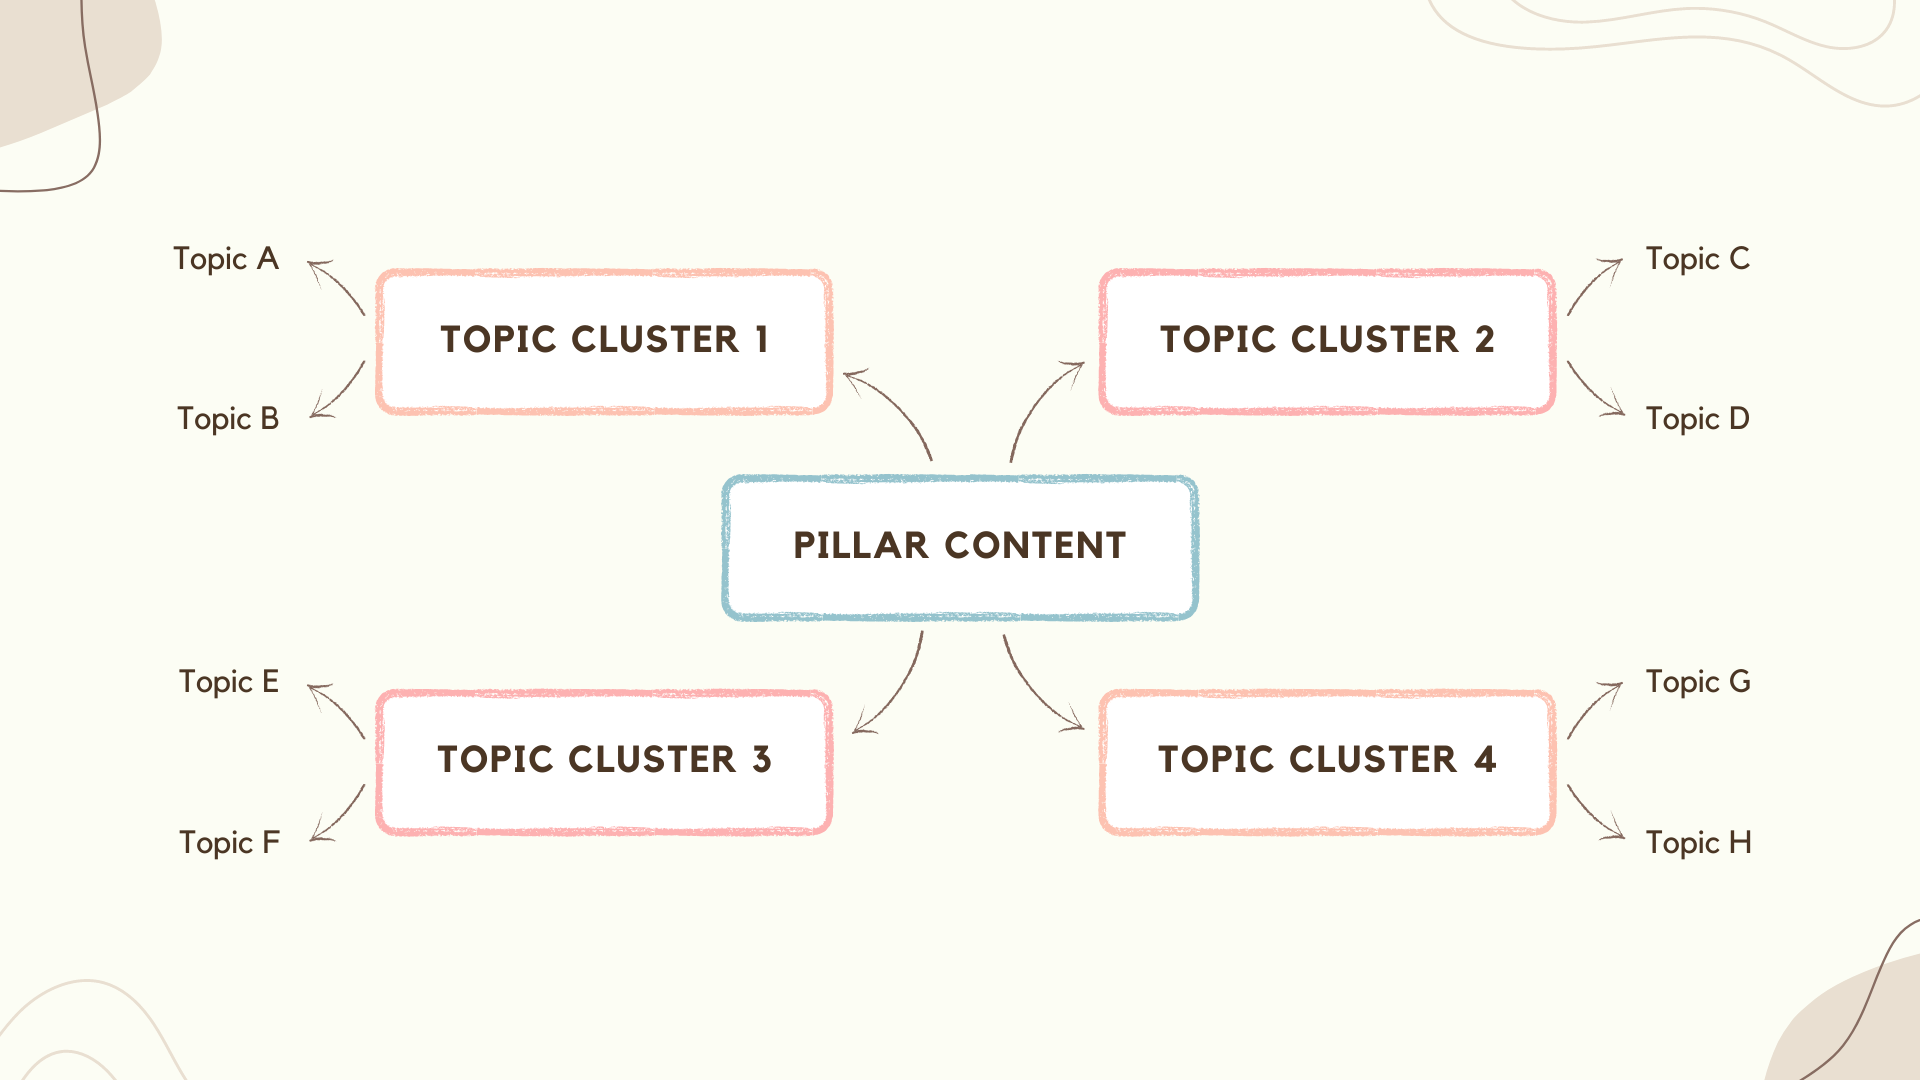
The landscape of search engine optimization (SEO) has evolved significantly over the years. In the past, SEO strategies were largely 'keyword-centric,' focusing on identifying specific search terms and sprinkling them generously throughout the content. However, as search engine algorithms have advanced, the emphasis has shifted from individual keywords to a broader, more holistic 'topic-centric' approach, often referred to as 'topic clusters.' This shift towards 'topic clusters SEO' entails organizing related content around one central theme or 'pillar content.' The pillar content is a comprehensive guide or overview on a broad topic, which serves as the core or 'cluster' around which multiple related, but more specific, pieces of content revolve. Wondering 'what is a topic cluster?' Simply put, it's a model that prioritizes topics over keywords. While keywords still play a vital role in SEO, this 'SEO cluster' approach presents a more structured and logically connected bundle of information for users, meeting their intent by offering comprehensive, interconnected content on a specific subject. To illustrate, let's consider some 'pillar content examples.' Imagine a detailed guide to digital marketing serving as your pillar content. More specific articles, such as those on SEO, content marketing, social media marketing, and so forth, linked back to the guide, serve as the cluster content.Understanding Topic ClustersAs the digital landscape continues to evolve, so does the sophistication of search engine algorithms, demanding a more structured and user-focused approach to content creation. Enter the concept of 'topic clusters' – a groundbreaking strategy in the world of Search Engine Optimization (SEO) and content marketing. Source: AhrefsAt its core, topic clusters involve grouping related pieces of content together to provide a comprehensive understanding of a subject, rather than treating each piece as an isolated unit. By adopting this model, webmasters not only cater to the semantic nature of search engines but also enhance the user experience, making information easier to navigate and digest. The ensuing discussion will delve deeper into the intricacies of topic clusters, their significance, and their application in modern-day digital content strategies.What are Topic Clusters?A topic cluster is a method of organizing and interlinking related content on a website. The model revolves around a central "pillar" page that provides an overview of a particular topic. This pillar content is then linked to multiple related, but more in-depth, articles known as "cluster content." These cluster contents elaborate on subtopics under the broader subject discussed in the pillar page. All cluster pages link back to the pillar page, establishing a network of interconnected information that provides comprehensive coverage of a specific topic. Topic clusters carry significant importance for several reasons: Enhanced User Experience: By grouping related content together, topic clusters make it easier for users to find and navigate information on a specific subject. This structured approach not only provides depth of knowledge but also improves the overall user experience, leading to longer site visits and potential higher conversion rates. Improved SEO: Topic clusters signal to search engines that your website contains authoritative, in-depth information on a particular topic. This semantic relationship between the pillar and cluster content helps search engines understand the context and relevance of your content, potentially improving your search ranking. Boosted Content Strategy: The topic cluster model can inform your content strategy by identifying gaps in your existing content or suggesting new, relevant subtopics to explore. Topic Clusters and Site ArchitectureUsing a topic cluster strategy inherently improves a site's architecture. In traditional website structures, pages are often disconnected, making it hard for search engine crawlers to understand the relationship between different content pieces. With the topic cluster model, the interlinking of related content creates a clear, logical site architecture that's easier for search engines to crawl and index.Source: FraseWhen search engine bots crawl a website, they follow links from one page to another. By interlinking pillar and cluster pages, you enable bots to crawl through a whole network of related content in a single visit. This efficient crawlability can enhance the visibility of your website on search engine result pages (SERPs), as search engines can better understand the breadth and depth of the content on your site. Moreover, a well-implemented topic cluster strategy helps distribute link equity across the website. When a cluster page garners backlinks, the linked pillar page benefits, and vice versa. This mutual boost in authority can further enhance the SEO performance of your website.Topic Clustering ChecklistThe realm of digital content is vast, and for brands and content creators aiming to establish authority and enhance visibility, a structured approach is vital. Topic clustering stands at the forefront of this approach, ensuring that content is not only user-focused but also aligns perfectly with search engine expectations. As you venture into the world of topic clustering, use this checklist to guide your strategy and execution: Identify Core Topic: Start by identifying a broad topic that is highly relevant to your niche. This should be something that your audience has demonstrated interest in and that has enough depth to generate multiple subtopics. Tools like Google Trends, keyword research tools, and social media can help you identify potential core topics. Brainstorm Subtopics: Once you've identified your core topic, brainstorm a list of subtopics that fall under this umbrella. These should be narrower topics that provide more specific information related to the core topic. For example, if your core topic is "Digital Marketing," subtopics might include "SEO," "Content Marketing," "Social Media Marketing," etc. Keyword Research: Conduct keyword research for your core topic and each subtopic. This helps to ensure that your content aligns with the terms and phrases your audience is actually searching for. Use keyword research tools to identify high-volume, low-competition keywords that can help your content rank higher in search results. Content Creation: Create high-quality, informative content for your core topic (your pillar page) and each subtopic. Your pillar page should provide a comprehensive overview of the core topic, while each subtopic should dive deeper into a specific aspect of the core topic. Ensure that your content is well-written, engaging, and provides value to the reader. Internal Linking: Once your pillar page and subtopic content pieces are live, establish a network of internal links between them. Each subtopic page should link back to the pillar page, and the pillar page should link to each subtopic page. This helps to establish the relationship between the pages and improve SEO. Optimization: Review each page to ensure it is fully optimized for SEO. This includes things like using your keywords in the title tag, meta description, URL, and throughout the content itself. Also, consider other SEO factors like mobile optimization, page speed, and image optimization. User Experience: Ensure that all of your content is easy to navigate and provides a positive user experience. This means using clear headings, easy-to-read fonts, and logical navigation. Also, ensure that your content is mobile-friendly, as more and more users are accessing content via mobile devices. Moving ForwardIn the intricate dance of digital visibility, implementing the strategies we've discussed can be your ticket to leading the performance. Yet, the realm of SEO is not static. As technology and user behaviors evolve, so will the methods to stay atop search results. We're on the brink of witnessing even more shifts, perhaps driven by advancements in AI, voice search, augmented reality, and who knows what unimaginable innovations the future holds. This constant evolution is what makes SEO both challenging and exhilarating. Staying informed, adaptable, and proactive in your strategies is not just advisable—it's indispensable. Embrace these changes, equip yourself with the latest knowledge, and watch your digital presence thrive in an ever-evolving landscape.Sources Ahrefs – Topic Clusters Frase – Topic Cluster HubSpot – Topic Clusters SEO CoSchedule – Topic Clusters

Unleashing the Potential of ChatGPT Plugins
The importance of AI in content marketing has seen exponential growth in recent years. As we increasingly shift towards a digital world, content has become the driving force behind engaging audiences and fostering brand relationships. AI, with its predictive analysis and data mining capabilities, is enabling marketers to create content that is not only engaging but also hyper-personalized. From generating highly targeted advertising campaigns to recommending content based on user behavior, AI is reshaping the way we create and distribute content, making it a crucial tool in the contemporary marketing landscape. Artificial Intelligence plays an instrumental role in streamlining various processes associated with content marketing. It aids in content creation, automates distribution, optimizes for SEO, and even measures performance. The adoption of AI helps marketers work more efficiently, allowing them to focus on strategic tasks while automating repetitive ones. More importantly, AI excels in generating personalized content - by analyzing user data and understanding individual preferences, it can create tailor-made content that resonates with each user. AI also drastically enhances the overall customer experience. By employing AI algorithms, marketers can better understand their audience's needs, tastes, and preferences, leading to more precise targeting and effective communication. Furthermore, AI chatbots and virtual assistants can provide real-time customer service, answering queries and providing solutions instantaneously. In an era where customers expect swift and personalized responses, AI helps meet these expectations, delivering superior customer experiences that foster brand loyalty and satisfaction.The Rise of Plugins: Introducing a Game-Changing TechnologyIn the realm of technology, a plugin refers to an additional software component or module that can be seamlessly integrated into an existing software or system. Plugins are designed to extend the functionality and capabilities of the host software, providing additional features and customization options. This game-changing technology has revolutionized various domains by offering the ability to enhance and tailor existing software or models according to specific needs. With the advent of ChatGPT Plugins, this concept has been taken to a new level, enabling users to add innovative extensions to AI models like ChatGPT, unlocking untapped potential and opening up a world of possibilities for more effective work and marketing purposes.Defining Plugins and Their SignificanceA plugin, in the context of technology, refers to a software component that adds specific functionalities or features to an existing software or system. It serves as an extension that can be seamlessly integrated into the host software, expanding its capabilities without requiring significant modifications to the core code. Plugins have found applications in various domains, ranging from content management systems (CMS) and web browsers to video editing software and graphic design tools. They allow users to enhance the functionality of software by adding new features, customization options, or integration with external services, making them incredibly versatile tools in the world of technology.Using plugins to enhance existing software or models offers several benefits: Extension of functionality without extensive coding or development work. Leverage existing software investments and adapt them to specific requirements. Customization based on individual needs, tailoring the software to unique workflows and preferences. Access to specialized features that may not be available in the core software. Unlocking new capabilities and expanding the range of tasks that can be accomplished. Promotion of modularity, allowing users to add or remove specific functionalities as needed. Ensuring a flexible and scalable software ecosystem. Understanding ChatGPT PluginsPlugins enhance the functionality of AI models like ChatGPT by providing an avenue to extend their capabilities. These plugins act as modular components that can be seamlessly integrated into ChatGPT, adding specific features and capabilities. For example, a plugin could enable sentiment analysis, language translation, or social media interaction within ChatGPT. This modular nature allows users to select and install plugins based on their specific needs, tailoring the AI model to their desired functionalities. One notable aspect of ChatGPT Plugins is their ability to add specific features and capabilities. Each plugin is designed to address a particular use case or provide a unique functionality. This focused approach allows users to enhance ChatGPT's performance in targeted areas. Whether it's generating content, improving language understanding, or enhancing user interactions, plugins enable users to extend the AI model's capabilities precisely where it is needed.While ChatGPT Plugins offer an incredible opportunity for customization, it's important to note that there is a limit to the number of plugins that can be enabled at once. This limitation ensures that the model's performance and user experience remain optimal. By carefully selecting the plugins that align with their goals, users can strike a balance between functionality and performance, creating a tailored experience that best suits their needs. The flexibility of ChatGPT Plugins empowers users to customize their AI experience and achieve tailored outcomes. Users can choose and combine plugins to create unique configurations that align with their specific requirements. This flexibility allows businesses and individuals to adapt ChatGPT to their workflows, industry-specific needs, and customer interactions. Whether it's creating personalized content, providing language support, or automating tasks, ChatGPT Plugins provide the tools for users to tailor their AI experience and unlock its full potential.Unlocking Untapped Potential: Discover the Power of ChatGPT PluginsPlugins offer immense versatility when it comes to enhancing productivity and streamlining workflows across various domains. Here are some key ways in which plugins can boost efficiency and streamline processes:Source: https://techcommunity.microsoft.com/t5/fasttrack-for-azure/how-chatgpt-plugins-could-work/ba-p/3761483 Task Automation: Plugins can automate repetitive and time-consuming tasks, allowing users to focus on more strategic and value-added activities. By automating routine processes, plugins help save time, reduce errors, and improve overall productivity. Integration and Collaboration: Plugins facilitate seamless integration with other software and services, enabling efficient collaboration and information sharing. They can connect different tools and platforms, allowing for smooth data transfer, real-time updates, and improved workflow coordination. Customization and Tailored Experiences: Plugins provide the flexibility to customize software and tailor it to specific needs. Users can choose and configure plugins according to their requirements, optimizing the software's functionality and interface for enhanced productivity and a personalized user experience. Specialized Functionality: Plugins offer specialized features and capabilities that may not be present in the core software. They extend the functionality of existing tools by adding niche functionalities, enabling users to perform specific tasks more efficiently and effectively. Scalability and Adaptability: Plugins enhance the scalability and adaptability of software by allowing users to add or remove functionalities as needed. This flexibility ensures that the software can grow and evolve alongside changing requirements, avoiding the need for complete overhauls or system replacements. Streamlined Workflows: By integrating plugins that streamline specific processes, workflows can be optimized for efficiency. Plugins can automate data entry, simplify complex tasks, provide advanced analytics, or enhance communication channels, resulting in smoother and more streamlined workflows. Enhanced Data Management: Plugins can assist in managing and analyzing data effectively. They can provide data visualization, data cleansing, data integration, or data analysis capabilities, helping users make informed decisions and derive meaningful insights from their data. The versatility of plugins lies in their ability to enhance productivity and streamline workflows through task automation, integration, customization, specialized functionality, scalability, and improved data management. By leveraging plugins, businesses and individuals can optimize their processes, save time, improve collaboration, and achieve higher levels of efficiency and effectiveness in their work.Some Useful ChatGPT PluginsNow that you know how to use plugins and how beneficial they are, we can go over some of the user-favorite plugins that can boost your productivity and efficiency while you are using ChatGPT for your work.Bing Search (Browse with Bing)Browsing with Bing is essentially a clever add-on that empowers ChatGPT to scour the web in real-time, enhancing its ability to respond to your inquiries with precision. It's one of two ingenious Plugins developed by OpenAI, and it's not just about web browsing, but also discerning when to leverage this ability and when to refrain. Think of it as a savvy assistant to ChatGPT, always on standby to explore the web and retrieve the most suitable results. How does this magic happen? When you pose a question to ChatGPT that calls for the latest data or knowledge beyond its training boundaries, the 'Browse with Bing' function jumps into gear. It sends a query to Bing, and the findings are then utilized to equip ChatGPT with the ability to offer you a response that's both current and pertinent.PromptPerfectReady to take your prompt-writing skills to another level? Then, you’re in the right place. Think of PromptPerfect as an enhancement to ChatGPT. When installed, it refines your input, namely the prompt you entered and adjusts it in the way that ChatGPT best understands and executes it. This, in turn, results in clearer and more on point answers.LinkReaderLinkReader is a high-tech tool that has the ability to understand and incorporate information from a multitude of digital sources. It's adept at handling various types of links, including those leading to web pages, PDFs, images, Word documents, and even PowerPoint presentations, thereby widening its interaction capabilities. It operates as a content decoder, accessing the raw material via a link, processing the embedded information, and then utilizing it to craft responses that are both accurate and contextually fitting. Phrases like 'read', 'interpret', 'analyze', 'understand', or 'summarize', when followed by a link, can activate this feature. The 'Link Reader' is a treasure trove of benefits. It can generate detailed responses based on the content of a linked web page or document, translate text from connected resources, condense extensive articles into summaries, and clarify complex concepts, among other things. Whether you need to summarize scholarly articles, extract valuable insights from web pages, dissect PDF reports, or get a quick overview of PowerPoint presentations without actually opening them, 'Link Reader' is your go-to tool.VoxScriptEver wanted to simply copy and paste what a video says? How convenient it would be, right? We can’t do that (yet) but with the VoxScript plugin, we can actually get the full script of a video. Take, for instance, a user who is keen on finding a particular topic on YouTube. They can employ the VoxScript ChatGPT Plugin to comb through video transcripts related to their area of interest. This feature proves invaluable when pinpointing specific details within a single video or across multiple videos.NoteableProject Jupyter, a non-profit and open-source initiative, has developed a product named Noteable. This product is a game-changer, designed to democratize data analysis and manipulation, making it user-friendly for individuals with varying skill levels. This plugin taps into the capabilities of OpenAI's natural language processing model. It allows you to effortlessly carry out sophisticated data analysis tasks within Noteable's computational notebooks, eliminating the necessity for intricate coding expertise.ExpediaThe Expedia ChatGPT Plugin enables users to interact with ChatGPT to inquire about their travel arrangements. They can pose questions like 'Which flights to Istanbul are the best?' or 'Can you suggest some budget-friendly hotels in Berlin?' In response, ChatGPT leverages the Expedia API to offer pertinent details and suggestions. Moreover, the plugin allows users to make reservations for flights, accommodations, and car rentals directly via ChatGPT. For instance, if a user requests 'Arrange a flight for me to New York next week', ChatGPT would employ the Expedia API to search for and book the flight that best suits the user's needs. Now, with the collaboration of Expedia and ChatGPT, flights are easier than ever to arrange.FAQsHow to Use ChatGPT plugins? To use ChatGPT plugins, you first need to install them. Once installed, they can be activated or deactivated as per your needs. Each plugin has specific activation keywords or phrases that trigger its functionality. For example, the 'Browse with Bing' plugin is activated when you ask a question that requires current data or information outside ChatGPT's training set. Are plugins available in ChatGPT? Yes, plugins are available in ChatGPT. They are designed to enhance the capabilities of the model by providing additional functionalities such as real-time internet browsing or reading and interpreting linked content.Are ChatGPT plugins safe? Yes, ChatGPT plugins are safe. They are developed by OpenAI, a reputable organization known for its commitment to safety and ethical AI development. However, as with any software, it's important to only install plugins from trusted sources.SOURCES OpenAI – ChatGPT Plugins Beebom – Best ChatGPT Plugins Search Engine Journal – How to Use ChatGPT Plugins for Work Microsoft Tech Community – How ChatGPT Plugins Could Work PCGuide – ChatGPT Plugins
TailwindCSS - Optimize Websites with Purge
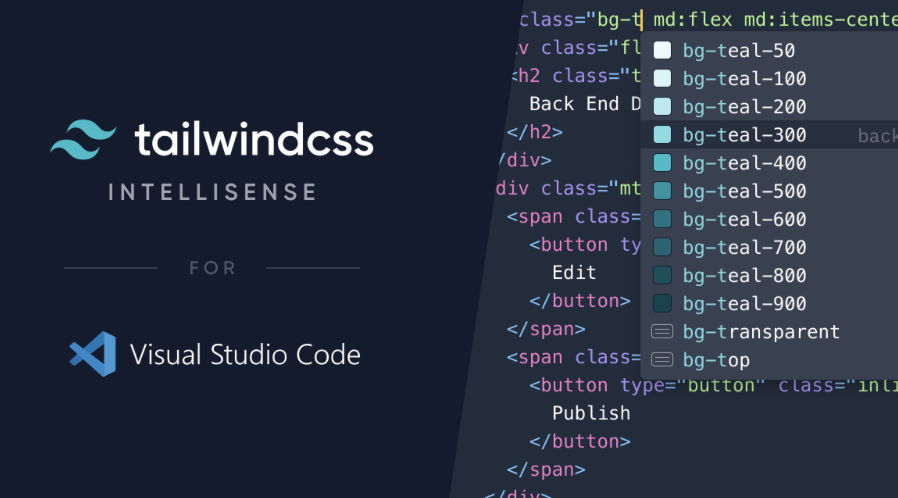
With the rapidly increasing popularity of the tailwind.css library in recent months and its purge tool, it has been observed that when setting up a website, including only the classes used on the page into the CSS file, compressing and optimizing them, significantly improves page performance. Let’s take a look together at how we can include the Tailwind.css library into our projects.What is Tailwind.CSS?Tailwind CSS is a CSS framework that web developers can use. A CSS framework includes a set of ready-made CSS classes used to create the look and style of web applications or sites.Tailwind CSS uses a unique approach. Instead of pre-built style sheets, it provides low-level CSS classes that can be applied directly to an HTML file. These classes represent a set of style properties and allow for faster and more flexible design.For example, to create a button, you can directly add Tailwind CSS classes to the class attribute in the HTML file. These classes can be used to add different colors, sizes, margins, and other properties to the button. Instead of creating custom CSS styles or relying on files, Tailwind CSS classes let you create fast and reusable components.Tailwind CSS provides a set of style properties and settings, and it allows you to configure them when needed. It has a customizable structure, so you can adapt it to the needs of your site or application.In conclusion, Tailwind CSS is a CSS framework that allows you to design websites quickly and effectively.How to Install Tailwind.CSS? - NPM & CDN InstallationsTo install and include the Tailwind.CSS library in your project, you can either install it with the help of NPM or Composer, or manually include it from CDN servers. We have shared both methods below. Tailwind.CSS NPM InstallationFirst, navigate to the folder where your project is running. This is usually the root directory of your project. Open the terminal and run the following command:npm initThis command creates a package.json file and helps you manage your project’s dependencies. Enter the required information according to your needs.To install Tailwind CSS, run the following command:npm install tailwindcss This command adds the Tailwind CSS dependency to your project.To create the Tailwind CSS configuration file, run the following command:npx tailwindcss initThis command creates a file called tailwind.config.js. This file contains the configuration settings for Tailwind CSS and allows you to customize them.You can configure Tailwind CSS settings by editing the created tailwind.config.js file. In this file, you can customize various settings such as colors, sizes, margins, and other styles.Include Tailwind CSS in your project’s CSS file. For example, if you have a file named styles.css, add the following @import directive:@import 'tailwindcss/base';@import 'tailwindcss/components';@import 'tailwindcss/utilities’;This imports Tailwind CSS’s base styles, components, and utility classes.Now you can start using Tailwind CSS classes in your HTML file through your CSS file. For example, you can create a button using Tailwind CSS classes:button class="bg-blue-500 hover:bg-blue-700 text-white font-bold py-2 px-4 rounded" Click mebuttonIn this way, you can use Tailwind CSS in your project. By exploring the other classes and features offered by Tailwind CSS, you can further enhance your design.Remember, after configuring Tailwind CSS for your project, you may need to compile your CSS files or configure your project. This may vary depending on the tools and setup you are using.Tailwind.CSS CDN InstallationTo add Tailwind CSS to your project using CDN (Content Delivery Network), follow these steps:Add the following link tag to the head section of your HTML file:link href="https://cdn.tailwindcss.com/2.2.19/tailwind.min.css" rel="stylesheet”This tag ensures that Tailwind CSS is downloaded from the CDN and used. In this example, version 2.2.19 of Tailwind CSS is used, but if you want to use the latest version, you can update the URL.You can start using Tailwind CSS classes in your HTML file. For example, you can create a button using Tailwind CSS classes:button class="bg-blue-500 hover:bg-blue-700 text-white font-bold py-2 px-4 rounded" Click mebuttonIn this way, you can use Tailwind CSS in your project via CDN. This allows you to design using Tailwind CSS’s style classes.To use the full features and all classes of Tailwind CSS, making a custom configuration and including your CSS files into the project may be a more flexible approach. However, for quickly prototyping or working on a small project, using a CDN can be practical.How to Use the Tailwind.CSS Purge System?The purge feature of Tailwind CSS is an optimization mechanism that ensures only the CSS classes actually needed in your project are included. This feature reduces the size of Tailwind CSS and increases performance.By default, Tailwind CSS has a wide style library containing many style classes. However, you may only be using a specific subset in your project. In this case, including all other unused classes in the CSS file would be unnecessary and increase the file size.The purge feature detects only the classes actually used in your project and includes only those in the CSS file. To do this, Tailwind CSS scans your project’s source code and performs static analysis to identify the used classes.You may need to specify which files to scan by configuring the purge feature in the tailwind.config.js file. For example:module.exports = { purge: ['./index.html'], // Other configuration settings...}In the above example, the purge feature scans the index.html file to determine the used classes. In this way, only these classes are included in the CSS file.Using the purge feature allows Tailwind CSS to reduce your project’s size and include only the used classes. This makes web pages load faster and reduces file sizes.Additionally, npm-watch can be used to monitor pages in real-time and track related classes. To do this, we recommend enabling Tailwind.CSS’s jit mode first. Thanks to this mode, watch operations run faster:module.exports = { mode: 'jit', purge: ['./index.html'], // Other configuration settings...}Then, add the following code to the scripts section of the package.json file on your system:"scripts": { "watch": "npx tailwindcss -i node_modules/tailwindcss/tailwind.css -o public/style.css -w --minify"},Finally, just run the npm watch command in your terminal. This way, with every change you make, npm will monitor the relevant files, and thanks to tailwind purge, only the used classes will be included in your CSS file and generate a minified output.

Voice Search Optimization, Content, and SEO: What is It and What Awaits Us?
Voice search is a technology that enables users to interact with search engines and digital assistants like Google Search Voice Command by speaking rather than typing queries. The relevance of optimizing content for voice search and virtual assistants has grown in tandem with the popularity of voice assistants such as Siri, Alexa, and Google Assistant. As more people use smart speakers and mobile devices with voice assistants, voice search is becoming more common. Source: https://www.nytimes.com/interactive/2018/08/17/technology/alexa-siri-conversation.html According to statista.com, the number of voice assistants worldwide can reach 8.4 billion by 2024. So, in order to get a larger audience and remain competitive in the digital market, businesses, and content creators must adjust their strategy to optimize for voice search. *Voice assistants in billions according to years 2019-2024 Source: https://www.statista.com/statistics/973815/worldwide-digital-voice-assistant-in-use/ In this guide, we'll explore the world of voice search and how to optimize your content to reach a wider audience. We'll cover everything from understanding natural language processing and identifying long-tail keywords to creating conversational phrases, optimizing for local voice search, and staying ahead of future trends. Whether you're a business owner or content creator, this guide will help you unlock the potential of voice search and take your online presence to the next level. Impact of Voice Search on Business and Industries Due to voice search's substantial effects on businesses and industries, companies are increasingly compelled to modify their online presence and marketing plans to account for customers' shifting search habits. To simplify, here are some impacts of voice search technology on businesses and industries: Changes in Search Behavior: As voice search gains popularity, people's online information-seeking habits are evolving. Compared to text-based searches, voice searches are typically longer and more conversational, and they frequently contain questions. In order to guarantee that they show up in voice search results, businesses must optimize their websites and content for natural language search inquiries. Increased Relevance of Featured Snippets: At the top of Google search results are Featured Snippets, which are succinct responses to search queries. These snippets are a crucial part of voice search optimization because they are frequently used as a response to voice search queries. Rise of Voice Commerce: Voice commerce is growing in popularity as smart speakers and virtual assistants become more prevalent. Customers may now make purchases directly from their smart speakers or virtual assistants using voice commands. Businesses have a great chance to take advantage of this trend and the expanding voice commerce trend. Need for Conversational User Interfaces (UI): Creating conversational interfaces that let people interact with their content and services using natural language is necessary for organizations to optimize for voice search. This entails producing material that is simple to comprehend and respond to as well as constructing user-friendly interfaces. There are actually countless instances where voice search technology has changed many important dynamics of business and organizations. Plus, it doesn’t seem to be out of fashion any time soon. That’s why every business owner and content creator should consider ways of optimizing for voice search. Working Mechanics of Voice Search In order to convert spoken words into text, voice assistants use ASR or automated speech recognition technology. ASR algorithms utilize language models and acoustic models to recognize the sounds being spoken as words and sentences. It's crucial to comprehend how voice assistants process and react to user inquiries in order to create content that is voice search-optimized. Content producers should concentrate on giving succinct, direct responses to frequently asked questions about their goods or services since voice search queries are frequently expressed as questions. This can entail writing FAQ pages in natural language, employing natural language in website content, and arranging the content in a way that voice assistants can understand it. Content creators can also utilize schema markup to give search engines more information about the material on their website. Search engines can leverage structured data from schema markup, such as details about the type of material, who wrote it, and when it was published, to better analyze the content on a webpage. Voice Search and Natural Language Processing Natural language processing (NLP) functions as a translator, helping computers in comprehending and interpreting human language. NLP is essential in the field of voice search to ensure that voice assistants like Siri and Alexa can comprehend and react to our inquiries correctly. This is due to the fact that while conversing, people use more intricate and natural language than when typing out search queries. Voice assistants can better grasp what we're asking for and offer more relevant results by using NLP. While generating content optimized for voice search, it's critical to keep NLP in mind as a content provider. This entails employing natural language terms and organizing your information in a way that addresses the types of queries that people may ask when speaking. This allows you to develop content that not only ranks higher in voice search results but also gives a better user experience. User’s Voice Search Queries In comparison to text-based queries, voice search questions are typically more conversational and organic. "Where can I locate the best restaurant in town?" or "What are the cheapest restaurants nearby?" are common queries. Making phone calls, creating reminders, getting weather updates, and asking for directions are among the more frequent voice search queries. As a content creator, it's important to consider these types of queries when optimizing your content for voice search and to structure your content in a conversational and natural way that answers these types of questions. Source: Personal archive, table generated by ChatGPT Natural language processing (NLP) has a big impact on the way we should create content, especially when it comes to optimizing for voice search. NLP helps voice assistants like Siri and Alexa understand and interpret the intent behind user queries, so it's important to use natural language phrases and structure your content in a way that answers the kinds of questions people might ask when speaking. This means focusing on long-tail, conversational keywords and using a more natural and conversational tone in your content. By doing so, you'll be able to create content that's more likely to appear in voice search results and provides a better user experience for those who use voice search to find information. Identifying Long-tail Keywords and Conversational Phrases Long-tail keywords are longer, more specific phrases that often contain three or more words. They are important in voice search because they reflect the conversational nature of spoken queries and can help you target a more specific audience. To identify long-tail keywords for your content, start by thinking about the questions your audience might ask when searching for information related to your topic. Use tools like Google's Keyword Planner to find related long-tail phrases and see how frequently they're searched. By incorporating long-tail keywords into your content in a natural way, you'll be better positioned to rank in voice search results and connect with users who are looking for the specific information you offer. Source: Personal archive, table generated by ChatGPTOptimizing for Local Voice Search Local SEO is especially important in voice search, as many users rely on voice assistants to find nearby businesses and services. By optimizing your content for local search terms and including information like your business address and phone number, you can increase your chances of appearing in voice search results for location-based queries. This means focusing on local keywords, creating content that's relevant to your specific location, and making sure your business information is up-to-date and consistent across all online platforms. Mobile Optimization and Voice Search Local SEO is crucial in voice search because many voice searches are location-based. People might ask, "What's the highest-rated coffee shop around here?" or "What are the hours for the next bus?". You may improve your chances of showing up in local voice search results for users in your area by optimizing your content for local search and incorporating location-specific keywords. This means focusing on things like Google My Business listings, location-specific content, and local keywords. By doing so, you'll be able to connect with local users and capture valuable local search traffic through voice search. What to Expect in the Future? Considering the place that voice search occupies today and the benefits and functions it offers us in our lives, it is almost certain that it will expand this place in the future. Here are three predictions for future voice search trends: More personalized results: As voice assistants become more advanced, they will be able to recognize individual voices and provide personalized search results based on a user's search history and preferences. Increased use in e-commerce: Voice search will become more prevalent in e-commerce as more people use voice assistants to search for and purchase products online. This will require businesses to optimize their e-commerce sites for voice search. Integration with other smart devices: Voice assistants will become more integrated with other smart devices, such as home automation systems and cars, allowing users to control their environment and access information hands-free. This will create new opportunities for businesses to reach consumers through voice search. FAQsWhat is voice search optimization and why is it important? The process of optimizing content and strategies to improve visibility and relevance in voice search results is referred to as voice search optimization. It is critical for businesses and content creators to optimize for voice search because the popularity of voice assistants and smart speakers is growing, and optimizing for voice search helps reach a larger audience and stay competitive in the digital market. How does natural language processing (NLP) impact voice search optimization? Natural language processing (NLP) is critical in optimizing voice search. NLP enables voice assistants to understand and interpret human language, allowing them to respond to user inquiries accurately. Businesses can improve the user experience and increase their chances of appearing in voice search results by using natural language phrases and structuring content in a conversational manner. Why are long-tail keywords and conversational phrases important for voice search optimization? Long-tail keywords and conversational phrases are important for voice search optimization because they correspond to how people ask questions and search for information when speaking. Businesses can target a specific audience and increase their visibility in voice search results by incorporating these into content, increasing their chances of connecting with users looking for specific information. How can businesses optimize their content for local voice search? Businesses should focus on local SEO strategies to optimize content for local voice search. Incorporating location-specific keywords, creating content relevant to the specific location, and ensuring accurate and consistent business information across online platforms are all part of this. Local voice search optimization allows businesses to connect with local users and capture valuable local search traffic via voice search. What is an example of voice search optimization? When businesses incorporate long-tail keywords and natural language phrases into their content to match how people ask questions when speaking, this is an example of voice search optimization. They organize their content in such a way that it provides direct and concise answers to frequently asked questions. What are the benefits of voice search optimization? Businesses and content creators can benefit from voice search optimization in a variety of ways. For starters, it allows you to reach a larger audience as the popularity of voice assistants and smart speakers grows. Businesses can increase their visibility and attract users who prefer voice commands by optimizing for voice search. Second, voice search optimization improves the user experience by responding to voice queries in a direct and concise manner. SOURCES Tailwind CSS – Official Installation Guide Tailwind CSS – Optimizing for Production (PurgeCSS) LogRocket – Getting Started with Tailwind CSS Smashing Magazine – Using Tailwind CSS in a Project Dev.to – Tailwind CSS with NPM & PurgeCSS

Business Intelligence Reporting: Revolutionizing Digital Marketing Strategies
Are you leveraging the power of data to optimize your digital marketing strategy? Business intelligence (BI) reporting is an essential component for any business to grow and thrive in today's data-driven world, especially in the digital marketing field. This article will explore the ins and outs of business intelligence reporting, its importance for digital marketers, and how it can be used to make data-driven decisions using tools like Looker Studio, BigQuery, GA4, Google Ads, and Facebook Ads. The Concept of Business Intelligence ReportingBusiness intelligence reporting refers to the process of collecting, analyzing, and presenting actionable insights from data to support decision-making in a business setting. It helps organizations gain a better understanding of their performance, identify opportunities for growth, and pinpoint areas that need improvement. In the digital marketing arena, BI reporting is critical for optimizing marketing campaigns, measuring ROI, and ensuring that resources are allocated effectively.Importance of Business Intelligence Reporting in Digital MarketingOrganizations must be agile and responsive to keep one step ahead of the competition given how quickly the digital marketing landscape is changing. Business intelligence reporting plays a pivotal role in achieving this by: Guiding Marketing Strategies: Data-driven insights can reveal trends and patterns that inform the direction of your marketing efforts, enabling you to make better decisions and achieve desired results. Improving Campaign Performance: Analyzing performance data allows you to identify high-performing channels and campaigns, which can then be scaled to maximize ROI. Enhancing Customer Targeting: By analyzing customer data, marketers can develop a deeper understanding of their target audience, enabling them to create more personalized and relevant messaging for improved engagement. Boosting Budget Efficiency: Through BI reporting, marketers can identify underperforming campaigns and make necessary adjustments, thereby reducing the wastage of resources and ensuring that marketing spend is allocated optimally.Tools for Business Intelligence Reporting in Digital MarketingTo harness the power of business intelligence reporting, digital marketers need a suite of tools that allow for seamless data collection, analysis, and visualization. Some of the most popular tools for BI reporting in digital marketing include: Looker Studio: A visualization tool by Google, Looker Studio allows users to create interactive reports and dashboards that consolidate data from various sources like Google Analytics, Google Ads, and BigQuery. With its user-friendly interface, digital marketers can easily visualize and share insights with their teams. BigQuery: A Google Cloud Platform service, BigQuery is a powerful data warehousing solution that enables users to store, manage, and analyze large volumes of data. It is particularly useful for digital marketers who need to process and analyze vast amounts of data from multiple sources quickly. GA4 (Google Analytics 4): As the latest iteration of Google Analytics, GA4 offers advanced features and machine learning capabilities that enable marketers to track user engagement, conversions, and other important metrics across their digital platforms. Google Ads: The go-to platform for running search and display advertising campaigns, Google Ads provides detailed performance data that can be analyzed to optimize campaigns for better ROI. Facebook Ads: With billions of users worldwide, Facebook is an essential platform for digital advertising. Facebook Ads Manager offers comprehensive reporting and analytics tools to help marketers track and optimize their campaigns.Best Practices for Enhanced Decision-making with Business Intelligence ReportingTo make the most of business intelligence reporting in digital marketing, marketers should adopt the following best practices: Integrate Data Sources: Consolidate data from multiple sources, such as Google Ads, Facebook Ads, and Google Analytics, to create a comprehensive view of your marketing performance. This holistic approach enables marketers to derive meaningful insights and develop well-informed strategies. Set Clear KPIs: Establish key performance indicators (KPIs) that align with your marketing goals and objectives. Monitor and analyze these KPIs regularly to measure progress and identify areas for improvement. This ensures that your marketing efforts remain focused on achieving the desired outcomes. Automate Reporting: Leveraging tools like Looker Studio to automate the reporting process saves time and ensures that data is consistently updated and accurate. This allows digital marketers to focus on analyzing insights and making data-driven decisions rather than getting bogged down with manual reporting tasks. Utilize Advanced Analytics Techniques: Employ advanced analytics techniques, such as predictive modeling and machine learning, to uncover hidden patterns and trends that can inform your marketing strategies. These cutting-edge methods can provide a competitive advantage by revealing untapped opportunities and enabling more precise targeting. Foster a Data-driven Culture: Encourage collaboration and data-driven decision-making across your organization by sharing insights and fostering open communication. This creates an environment where everyone is working towards the same goals and using data to make informed decisions. Continuously Optimize: Regularly review and analyze your BI reports to identify opportunities for improvement and optimization. Adjust your marketing strategies and tactics accordingly to maximize ROI. By staying agile and adaptive, digital marketers can ensure their campaigns remain effective in the ever-evolving digital landscape. ConclusionBusiness intelligence reporting is a game-changer for digital marketing professionals, enabling them to make data-driven decisions that drive growth and success. By leveraging tools like Looker Studio, BigQuery, GA4, Google Ads, and Facebook Ads, digital marketers can gain a comprehensive understanding of their performance, optimize campaigns, and allocate resources more effectively.Embrace the power of BI reporting and watch your digital marketing strategy reach new heights. In an increasingly competitive digital marketing environment, businesses cannot afford to ignore the insights and advantages offered by BI reporting. The ability to stay agile and adapt to market changes will be the determining factor in the success of your digital marketing efforts. Embracing the power of business intelligence reporting will equip your organization with the tools needed to navigate the complexities of the digital marketing landscape and achieve new heights of success.As digital marketing continues to evolve, so will the capabilities of BI reporting tools and technologies. Stay ahead of the curve by continually investing in your knowledge and understanding of BI reporting and analytics. Doing so will ensure that you remain well-prepared to capitalize on the ever-changing opportunities presented by the digital marketing world.