


Analytica House
Jan 5, 2023Next Generation Behavioral Analysis Tool: Microsoft Clarity

To analyze the users visiting your site and make your current site compatible with user experience (UX), you need next-generation behavioral analytics tools.
At this point, Microsoft Clarity comes into play as a next-generation behavioral analytics tool. If you haven’t heard of Microsoft Clarity before, don’t worry. In this article, we will answer the question “What is Microsoft Clarity?” in detail and share the nuances of how you can use Clarity to perform analyses and make your site UX-compliant.
What Is Microsoft Clarity?
Microsoft Clarity is a free behavioral analytics tool launched by Microsoft in 2020 that transforms user data into visual insights and shows which parts of your website receive the most interaction. It offers features such as dashboards, heatmaps, session recordings, rage clicks, and dead clicks to help you easily analyze issues that frustrate users.
Microsoft Clarity tracks users’ movements on your website to measure and analyze site performance. By measuring every user interaction, it guides you to improve your site’s quality and eliminate errors.
In addition to being free, Microsoft Clarity has no traffic limits and is optimized not to slow down your site, making it more advantageous and preferable compared to other behavioral analytics tools.
Thanks to its lack of traffic limits, even sites with very high traffic (e.g., 1 million daily visits) can easily use Clarity. Because it is optimized not to slow down page load times, it has less impact on page performance than other tools, ensuring that users don’t have to wait and thus positively impacting user experience. With its intuitive interface, detailed filtering options, heatmaps, and session recordings, you can perform a detailed UX analysis of your site; detect dead clicks, rage clicks, and JavaScript errors on your platforms, and improve the current situation.
What Are the Features of Microsoft Clarity?
The most critical and important feature of Microsoft Clarity for brand and UX analysts is its control panel.
In addition to the control panel, with Clarity you can see which page visits users have made on your site (via the Recordings section) and exactly where each visitor clicked (via the Heatmaps section), and from that you can refine your UX analyses.
If we look at each page, first let’s see what greets us on the Dashboard:
Dashboard
As you can see in the image below, once you create your site project in the tool and complete the necessary setup, a dashboard appears where you can easily view all detailed parameters. The control panel provides a general overview of your site visitors’ performance and behavior, allowing you to analyze site traffic in detail and perform aggregate measurements. You can track users’ page movements and view any errors they encountered during their session in detail.

In summary, the control panel provides a series of website metrics, which can be described as follows:

- Sessions: The number of sessions users have on your website, shown as Total Sessions on the dashboard.
- Pages per Session: The average number of pages per session that users view on your site.
- Scroll Depth: The percentage of the page that users scroll down on your site.
- Time Spent: Displays how long users spend on your site actively and inactively.
While metrics like Sessions and Scroll Depth inform us about session counts and durations, the metrics below use click data to reveal errors users encounter and the clicks that caused them:

- Dead Clicks: When users click on an element on your site but get no response. Dead clicks often indicate broken links or JavaScript errors.
- Rage Clicks: When a user repeatedly clicks in one area, usually due to frustration from dead clicks. Rage clicks can point to insufficient target sizes or misleading visual design.
- Excessive Scrolling: When a user scrolls up and down a page more frequently than average. Excessive scrolling can indicate poor discoverability or irrelevant content.
- Quick Backs: When users quickly return to the previous page after navigating to a page. High quick-back rates may indicate misleading or inaccurate content descriptions.
You can also analyze which locations and devices users come from and which pages or products they view most often on your site:
- Most Viewed Products: On an e-commerce site, shows which product receives the most views.
- Popular Pages: Displays the most visited pages on your site.
- Referrers: Shows which external pages users came from to visit your site.
- Browsers: Displays which browsers users use to access your site, helping segment the audience more meaningfully.
- Devices: Shows which devices users use to visit your site, aiding audience analysis.
- Countries: Displays the countries from which users visit your site, allowing you to tailor site design to your audience.

The filter at the top of the control panel lets you customize analyses by page, date, or device, making Clarity an exceptional experience for UX analysis.
Recordings
The Recordings page lets you watch recordings of user sessions on your site. Using the Recording section, you can replay each visitor’s page visits and see exactly where they clicked, what they scrolled, paused on, and which other pages they navigated to. By applying filters for dead clicks, rage clicks, or JavaScript errors, you can focus on those sessions and create an action plan to minimize these issues.
The Recordings page displays user sessions as a timeline and allows you to play back each session like a video, making Clarity a must-have next-gen behavioral analytics tool for UX analysts. In addition to tracking cursor movements and clicks, recordings also provide details like entry and exit URLs, session duration, date, and device. The “Skip Inactive” button helps you save time by skipping long idle periods when reviewing multiple sessions.
Recordings also reveal how long users waited during a session and give insights into page load times, which can inform your SEO efforts. The “More Details” option on each video presents a timeline of user actions, giving you deeper insights into both sessions and users.

Heatmaps
Microsoft Clarity’s heatmaps help you easily understand how users interact with a page by visualizing sessions with color gradients from red to blue. Warmer colors (reds) show areas with high click density, while cooler colors (blues) indicate areas with low interaction.
This feature lets you see exactly where users clicked and how far they scrolled, offering clues about why and how they reached specific areas. Clarity provides three types of heatmaps for in-depth UX analysis:
- Click Heatmaps: Shows clicks by desktop, mobile, or tablet users on your site.
- Scroll Heatmaps: Displays the percentage of the page viewed by users as they scroll down.
- Area Heatmaps: Indicates regional clicks by desktop, mobile, or tablet users on your site.

By filtering click and area click data for specific date ranges, you can identify which areas of your site’s homepage were most engaging. For example, during Black Friday, you might find that users clicked most on “Women > Jeans.” Further analysis may reveal that mobile users most often clicked “Mom Jeans,” size 32/33, in Dark Blue, but encountered dead clicks on the size filter, preventing them from reaching the cart. This indicates a need for quick fixes in that area to improve conversion.
Additionally, for future campaigns, you could use remarketing to target mobile users interested in “Mom Jeans,” size 32/33, Dark Blue, thereby improving conversion rates. From these examples and Clarity’s versatile panels, it’s clear that Microsoft Clarity is arguably the best next-gen behavioral analytics tool for UX analysis on your sites.
We hope this article encourages you to integrate Microsoft Clarity more into your UX analyses.
See you in our next article...
More resources

Detect Performance Drops Early with Anomaly Detection
In digital products, the most critical problems are often the ones noticed the latest. Traffic drops...
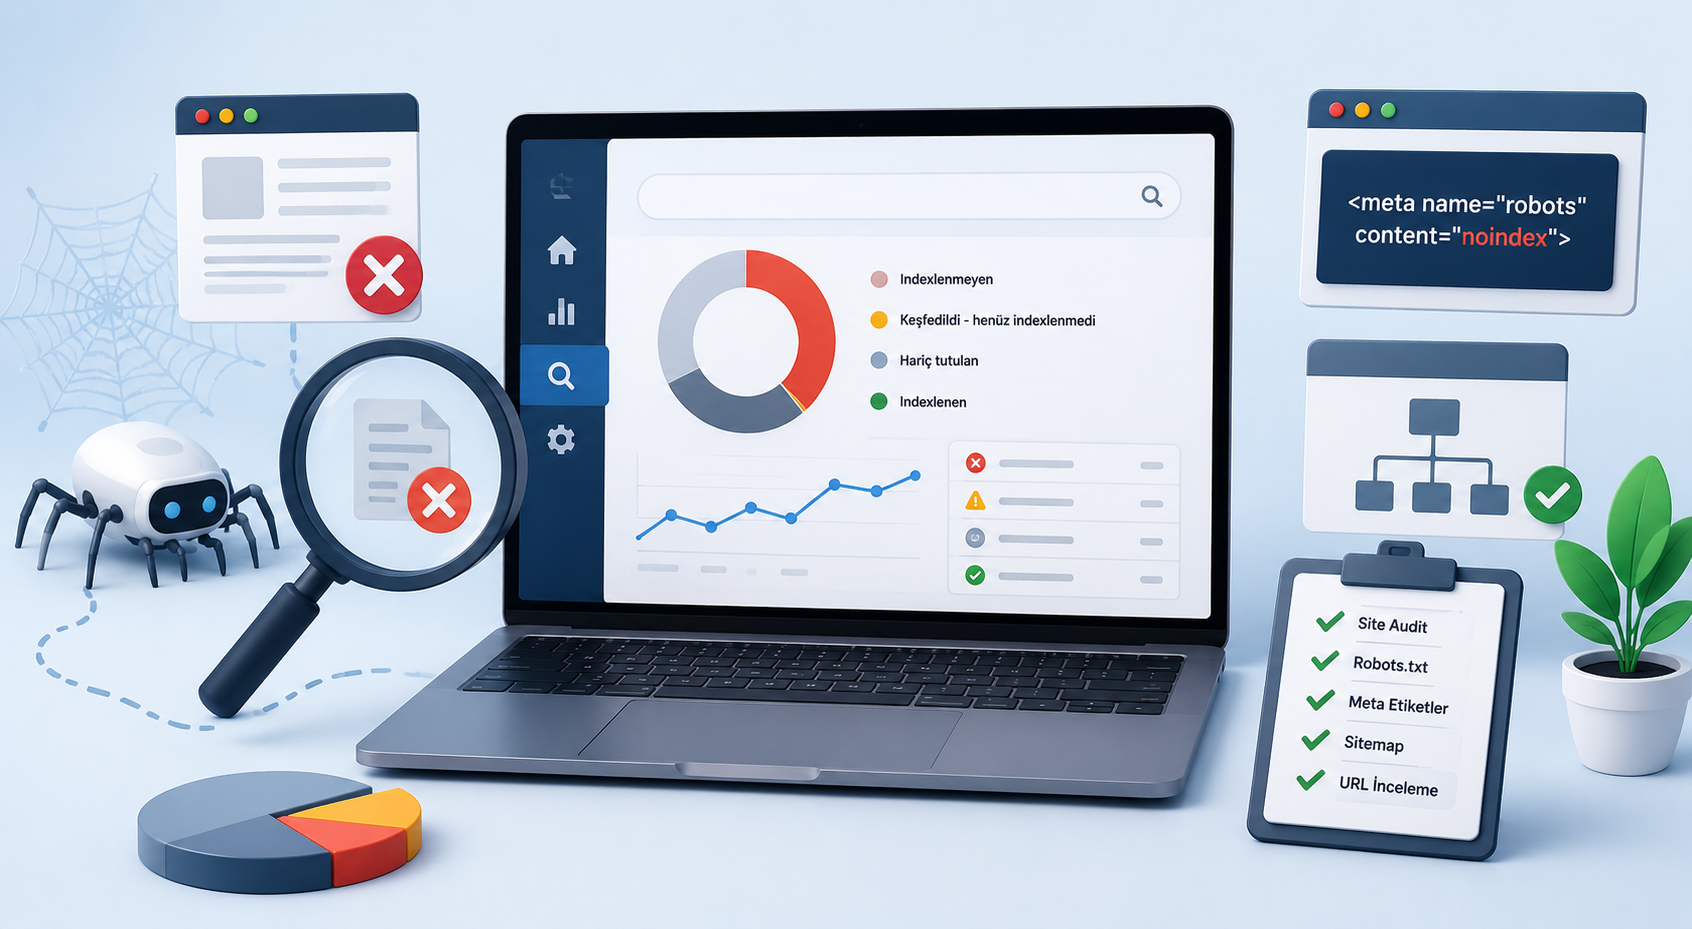
How to Identify Non-Indexed Pages?
If you manage a website or monitor SEO processes, you know that the foundation of your digital prese...
How Do 404, 410, and 401 Status Codes Affect SEO?
In the digital world, the technical health of your website is one of the most fundamental factors de...