
Analytica House
Eki 21, 2022Pazar Sepeti Analizi
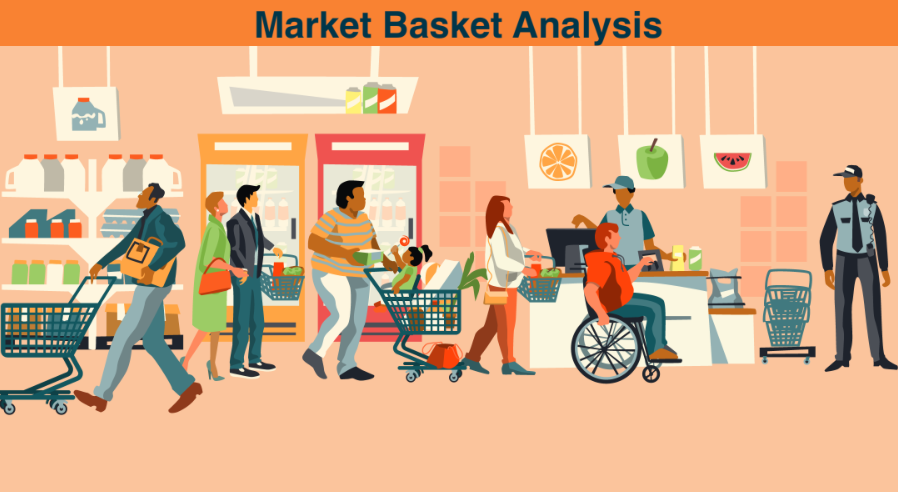
Günümüzde, hepimizin bildiği pandemiden sonra e-ticaret sektörü adeta güneş gibi doğdu. Bu yükselişle birlikte, nispeten küçük işletmelerden en büyük markalara kadar neredeyse her markanın web siteleri çok daha fazla popülerlik kazandı ve trafiklerini yaklaşık %50 artırdı. Uluslararası Ticaret İdaresi’ne (2021) göre, pandemi sonrası e-ticaret gelirlerinde ortalama %19’luk (Gıda ve Kişisel Bakım ürünlerinde %26) bir artış öngörülüyor.
Bu büyüme istatistikleri ve gelişmeler bize işletmelerin e-ticaret/pazarlama departmanlarına ve operasyonlarına daha fazla dikkat (ve daha fazla bütçe) ayırmaları gerektiğini açıkça gösteriyor.
E-ticaret denildiğinde akla gelen ilk şey tabii ki web siteleridir. Ürünler, işletme sahiplerinin daha fazla ürün satmasına ve en değerli kaynakları olan müşterilerden daha fazla gelir elde etmesine yardımcı olacak şekilde web sitelerinde sergilenmeye çalışılmaktadır.
Müşterilerin dikkatini çekmenin ve onlara daha fazla satın alma isteği vermenin onlarca yolu vardır. Bu yazıda, “Sepet Analizi” adı verilen bir yöntemden bahsetmeye çalışacağım.
Sepet Analizi Nedir?
Sepet Analizi, müşterilerin web sitesindeki sepetlerini (alışveriş sepetlerini) araştıran ve inceleyen, ardından müşterilere anlamlı ve kişiselleştirilmiş ürün önerileri sunmak için analiz eden bir yöntemdir. Analizin teknik kısmına geçmeden önce bahsetmemiz gereken birkaç nokta daha var.
- Her müşteri farklıdır ve satın alma davranışları da farklıdır.
- Her ürün farklıdır. Ancak, bazıları birlikte kullanılır ve satın alınır.
- Bazı durumlarda, tamamen ilgisiz ürünler birlikte satılır ve insan gözü bunları her zaman belirleyemez.
Tam da burada yapay zeka ve makine öğrenmesi devreye giriyor.
Haydi algoritmalara daha derin dalalım.

Apriori Algoritması
Apriori algoritması 1994’ten beri aklımızda ve veri kümelerinde sık görülen öğe setlerini, boolean ilişki kuralları için bulmamıza yardımcı oluyor. Algoritmanın adı Apriori çünkü sık görülen öğe seti özelliklerine dair önceden bilgilere dayanıyor.
Bu algoritmada, yukarıda bahsedildiği gibi veri kümesi sık satın alınan ürünleri içermelidir. Bu algoritmayı uygulamak için ihtiyaç duyduğumuz veriler aşağıdaki sütunları içerir:
- İşlem ID’si (Sepet ID’si)
- Ürün SKU’su (Ürün ID’si)
- Ürün Kategorisi
- Adet
Gerekli verileri elde ettikten sonra, sihir başlar.
Bu algoritma R Studio, Python vb. ile yazılıp uygulanabilir.
Verilerimiz parçalanmış ve dolayısıyla yinelenen işlem ID’leri içerdiğinden, öncelikle verileri işlem ID’sine göre gruplamamız ve o belirli işlemde (ödeme adımından önce sepete eklenmiş olan) satılan her benzersiz ürünü öğrenmemiz gerekir.
Bu işlem tamamlandıktan sonra, tüm ürünlerin dummy değişkenlerini oluşturur ve her biri için yeni sütunlar açarız. Her benzersiz işlem satırı için ürünün adedi kendi sütununa ve işlemine yazılır. Aşağıda örnek işlenmiş veriler görülebilir:
| Transaction ID | Product A | Product B | Product C | Product D |
| 123abc | 7 | 3 | 0 | 0 |
| 456def | 2 | 0 | 1 | 1 |
Makine öğrenmesinin kendine ait kuralları vardır.
Bu verileri analiz edebilmek ve anlamlı içgörüler elde edebilmek için hücreleri 1-0 olarak kodlamamız gerekir. Böylece belirli bir işlemde hangi ürünün sepete eklendiğini ve satın alındığını belirleyebiliriz. Bunun nedeni Apriori Algoritmalarının ürünler arasındaki ilişkiyi belirlemek için yalnızca 1 ve 0 değerlerini kabul etmesi ve ilgisiz miktarlardan doğabilecek yanlılıkları ortadan kaldırmasıdır. Burada yalnızca birlikte satılan ürünlerle ilgileniyoruz.
Son olarak, modeli uygulamadan önce aşağıdaki verileri elde ederiz:
| Transaction ID | Product A | Product B | Product C | Product D |
| 123abc | 1 | 1 | 0 | 0 |
| 456def | 1 | 0 | 1 | 1 |
Modeli optimize ve hızlı bir şekilde uygulamak için “mlxtend” kütüphanesinden “frequent_patterns“ aracını, “apriori” ve “association_rules” paketlerini kullanırız.
Gerekli parametreler belirli veri kümesine ve belirli amaca göre ayarlandıktan sonra, sonuçları aşağıdaki tablo şeklinde elde ederiz:
| Antecedents | Consequents | Antecedent Support | Consequent Support | Support | Confidence | Lift | Leverage | Conviction |
| Product A | Product B | 0.4 | 0.6 | 0.5 | 0.83 | 2.78 | 0.022 | 1.67 |
| Product A | Product C | 0.4 | 0.3 | 0.45 | 0.65 | 2.11 | 0.1 | 1.12 |
| Product B | Product D | 0.6 | 0.5 | 0.5 | 0.62 | 1.98 | -0.32 | 1.43 |
Not: Gizlilik nedeniyle değerler rastgele oluşturulmuştur.
Sonuçlar: Tamam. Ama Ne Anlama Geliyorlar?
Burada dikkate almamız gereken en önemli metrikler “support” ve “confidence” değerleridir. Ancak daha iyi anlamak için aşağıdaki açıklamaları okuyabilirsiniz.
- Antecedent Support: Önceki ürünlerin toplam içindeki bulunma oranı.
- Consequent Support: Sonraki ürünlerin toplam içindeki bulunma oranı.
- Support: Önceki ürün ve sonraki ürünün aynı sepette birlikte bulunma oranı.
- Confidence: Ürünlerin aynı sepette birlikte bulunma güven oranı.
- Lift: Beklenen güvene göre güven oranı.
- Leverage: Belirli bir sepetin, içindeki ürünlere göre istatistiksel bağımsızlık oranı.
- Conviction: Sonraki ürünün önceki ürüne yüksek derecede bağımlı olması durumunda yükselir.
Sonuç tablosunu elde ettikten sonra, sonuçları analiz etmeye başlayabiliriz. Bu analizi bazı istatistiksel yöntemlere göre yaparız. “Confidence” metriği için bir eşik değeri belirlememiz ve satırları ikiye ayırmamız gerekir: Anlamlı veya Anlamsız.
Confidence değeri eşik değerden (örneğin 0.6) büyük olduğunda, bu ürünler arasındaki ilişkinin anlamlı olduğunu ve müşterilerin bu ürünleri sıkça birlikte aldığını söyleyebiliriz.

Bu Sonuçlar Nerede Kullanılır?
Bu sonuçların nerede kullanılacağı ayrı bir konudur. İşletmeler genellikle bu bilgiyi öneri algoritmaları ve raf tasarımı için kullanır.
Örneğin, Product A’yı sepete yeni ekleyen müşteriye Product B önerilir çünkü bu ürünlerin güven seviyesi bizim eşik değerimizin üzerindedir. Böylece müşterinin Product B’yi kaçırma, unutma ya da ilgilenmeme ihtimali azalır ve müşteriyi Product B satın almaya yönlendirmiş oluruz.
İkinci olarak, raf tasarımı (bizim durumumuzda ürün listeleme sayfaları) sonuçlara göre yapılabilir ve web sitemize uygulanabilir. Örneğin, Product A ve Product B yan yana konumlandırılarak müşterilere birlikte satın alabilecekleri hatırlatılır (çünkü genelde öyle yapıyorlar, değil mi?!). Üçüncü olarak, müşterilere yönelik kampanya senaryoları kurgulanabilir. Örneğin, Product A’yı sepetine ekleyen müşterilere Product B indirimli fiyatlarla sunulabilir ya da daha önce satın alanlara uygulanabilir.
Son olarak, bu analiz sonuçları işletme sahiplerine ve pazarlamacılara fiziksel mağazalarının raflarını tasarlamada yardımcı olabilir. Web sitelerindeki ürün listeleme sayfaları gibi mağaza rafları da müşterilerin ilişkili ve sıkça satın aldığı ürünleri birlikte görebileceği şekilde tasarlanabilir.
Bu yollarla, satış miktarı, sipariş sayısı, gelir, web sitesinin kazandığı trafik ve benzeri kilit performans göstergeleri artırılabilir. Ayrıca, ürün ve pazarlama maliyetleri de sonuçlara göre dağıtılabilir.
More resources

Google MMM ile Satış Artışlarını Doğru Ölçmenin 5 Yolu
Google MMM (Marketing Mix Modeling), pazarlama karması modellemesi olarak bilinen bu yöntem, çerezsi...
ChatGPT Shopping Research Nedir? Nasıl Çalışır?
ChatGPT Shopping Research, kullanıcıların alışveriş araştırmalarını hızlandıran yapay zeka destekli...

Black Friday Sonrası Sadık Müşteri Kazanmak İçin Veri Tabanlı Taktikler
Sadık müşteri kazanımı, Black Friday sonrası dönemde e-ticaretin en stratejik hedeflerinden biridi...

