

Marketing tips, news and more
Explore expert-backed articles on SEO, data, AI, and performance marketing. From strategic trends to hands-on tips, our blog delivers everything you need to grow smarter.

What Are Performance Marketing Metrics? The 15 Most Commonly Used Metrics
Marketing metrics play a crucial role in interpreting the campaigns we launch and the ads we create. It’s essential to derive insights from the data we have and take action accordingly. Accurately analyzing a campaign’s metrics and taking the most effective actions during this process is critical.Misinterpreting performance success—whether through missing or incorrect analysis—can lead to mistakes in judging whether our campaign is performing well, causing both short- and long-term missteps. In this article, we’ll share tips on how to correctly interpret the most frequently tracked and most important metrics in performance marketing.What Does “Metric” Mean in Performance Marketing?Marketing teams use measurable figures called marketing metrics to show the success of campaigns and projects across all channels. Examples include Conversion, CTR, and ROAS.What Is a Conversion?When creating a digital marketing campaign, every brand has one or more goals that motivate users to take action. All marketing efforts are ultimately aimed at achieving these goals.A Conversion is the metric that counts how many times a specified goal is achieved within a website, page, or mobile app. For an e-commerce company, this metric might be the number of sales; for a consulting firm, the number of leads (form submissions). A high conversion rate indicates your ad campaign is successful and your landing page content is compelling.If your conversion count is low, you might improve it by changing site content, creating new funnels to simplify the conversion process, or updating offers to provide a more effective experience for users.What Is Conversion Rate?Conversion Rate measures how often conversions occur as a result of your ads. It shows the percentage of ad interactions that turn into your defined conversion goal. By looking at conversion rate, you can optimize landing pages, calls to action, content, and design, and gauge how compelling your ads are to your target audience. Conversion Rate is calculated by dividing the number of conversions by the total number of sessions. For example, if an ad generates 300 sessions and 10 conversions, the conversion rate is 3%.What Is Conversion Value?Conversion Value assigns a numerical value to specific conversions in your campaigns, helping you measure how valuable those conversions are to your business. By assigning different values to different conversions, you can make your campaign’s value measurement more meaningful. You can compute Conversion Value using the formula: Sessions × CR × Average Order Value.For example, if a shoe retailer has 10,000 sessions, a 1% conversion rate, and an average order value of 1,000 TL, the Conversion Value is 100,000 TL.What Is CPC?CPC (Cost Per Click) simply shows how much you pay for each click. Because you pay per click, irrelevant users clicking on your ads increase your unnecessary costs and raise your total spend.CPC is one of the key metrics for evaluating campaign performance. To lower CPC, you can optimize ad relevance, switch bidding strategies, and target the right keywords through analysis.What Is a Session?In digital analytics, a session measures a user’s interactions on a website within a given time frame. A session begins when the site loads and ends when the user closes the site or is inactive for 30 minutes. It encompasses pageviews, events, and other actions the user takes.To increase session duration, enhance site experience—improve design, readability, navigation, and content to keep users engaged and complete your desired conversions.What Is CPS (Cost Per Session)?CPS measures the cost of each session driven by your ads. Since sessions reflect active user engagement on your platform, Cost Per Session shows how much each session costs based on your ad spend.What Is ROAS?ROAS (Return on Ad Spend) measures your ad performance in terms of cost versus revenue. It represents the profit you earn for every unit of currency spent on ads. Since brands aim to get a strong return on investment, tracking ROAS provides powerful insights into campaign success.For instance, even if an ad brings in many high-quality users and revenue, it’s not a cost-effective spend if the cost exceeds the revenue. ROAS tracking helps you avoid such scenarios.What Is CTR (Click-Through Rate)?CTR measures the percentage of ad impressions that result in clicks. It indicates how relevant and compelling your ads are to your target audience. A high CTR is critical in PPC, as it affects Quality Score and indirectly the cost per click. Google Ads and other platforms reward high-quality ads with lower costs.If a competitor pays the same CPC but has a lower Quality Score, you may pay less to achieve a higher ad position. You can boost CTR by including search terms in headlines and descriptions, adding URL paths, and targeting the right keywords.In display campaigns, where creative visuals matter most, CTR offers insight into the effectiveness of your creatives.What Is a Lead?In marketing, a lead typically refers to a form submission generated by your campaigns. Each lead represents a potential customer. However, a high lead count doesn’t always mean campaign success—lead quality matters most. That’s why defining your buyer persona and targeting accordingly is crucial.To convert leads into sales, provide personalized content, maintain close collaboration with your sales team, and guide users along the funnel.What Is CPL (Cost Per Lead)?CPL measures how much each lead costs you. It shows whether you’re allocating your budget effectively. By comparing CPL across channels, you can reallocate budget from high-CPL channels to those generating leads more efficiently.CPL = Total Ad Spend / Number of Leads.What Is Search Impression Share?Search Impression Share is the ratio of impressions you received to the total impressions you were eligible to receive. Eligibility depends on factors like audience targeting, approved ads, bids, and Quality Score. For example, a 50% impression share means you appeared in half of the available auctions.If your impression share is low, you’re missing potential customers. Increasing impression share relies on high Quality Scores, sufficient bids, and adequate budgets.What Is Top Impression Share?Top Impression Share measures how often your ad appears above organic search results. If you notice your click-through rates dropping, it may indicate you’ve lost a top position.What Is Absolute Top Impression Share?Absolute Top Impression Share is the percentage of your total impressions that appear in the very top ad position. It’s calculated as impressions in the top position divided by the estimated eligible impressions for that position.What Is Bounce Rate?Bounce Rate is the percentage of users who leave your site after viewing only one page without taking any action. Tracking bounce rate helps you assess site experience. A high bounce rate can signal issues such as irrelevant content, slow loading times, or poor mobile optimization.To lower bounce rate, define your audience accurately, optimize page load speed, and use clear, compelling CTAs.Bounce Rate = (Single-Page Sessions / Total Sessions) × 100.What Is Frequency?Frequency measures how often a user sees your ad. Multiple impressions can help undecided users purchase, but if they see the ad repeatedly without converting, you may need to broaden your audience or adjust spend.Very high frequency can annoy users and harm your brand. Expand your targeting or reduce budget if frequency is too high. Ideal frequency varies: it’s lower for new-user campaigns and higher for remarketing. Determine your target frequency by reviewing past campaigns to find where CPA was minimized.
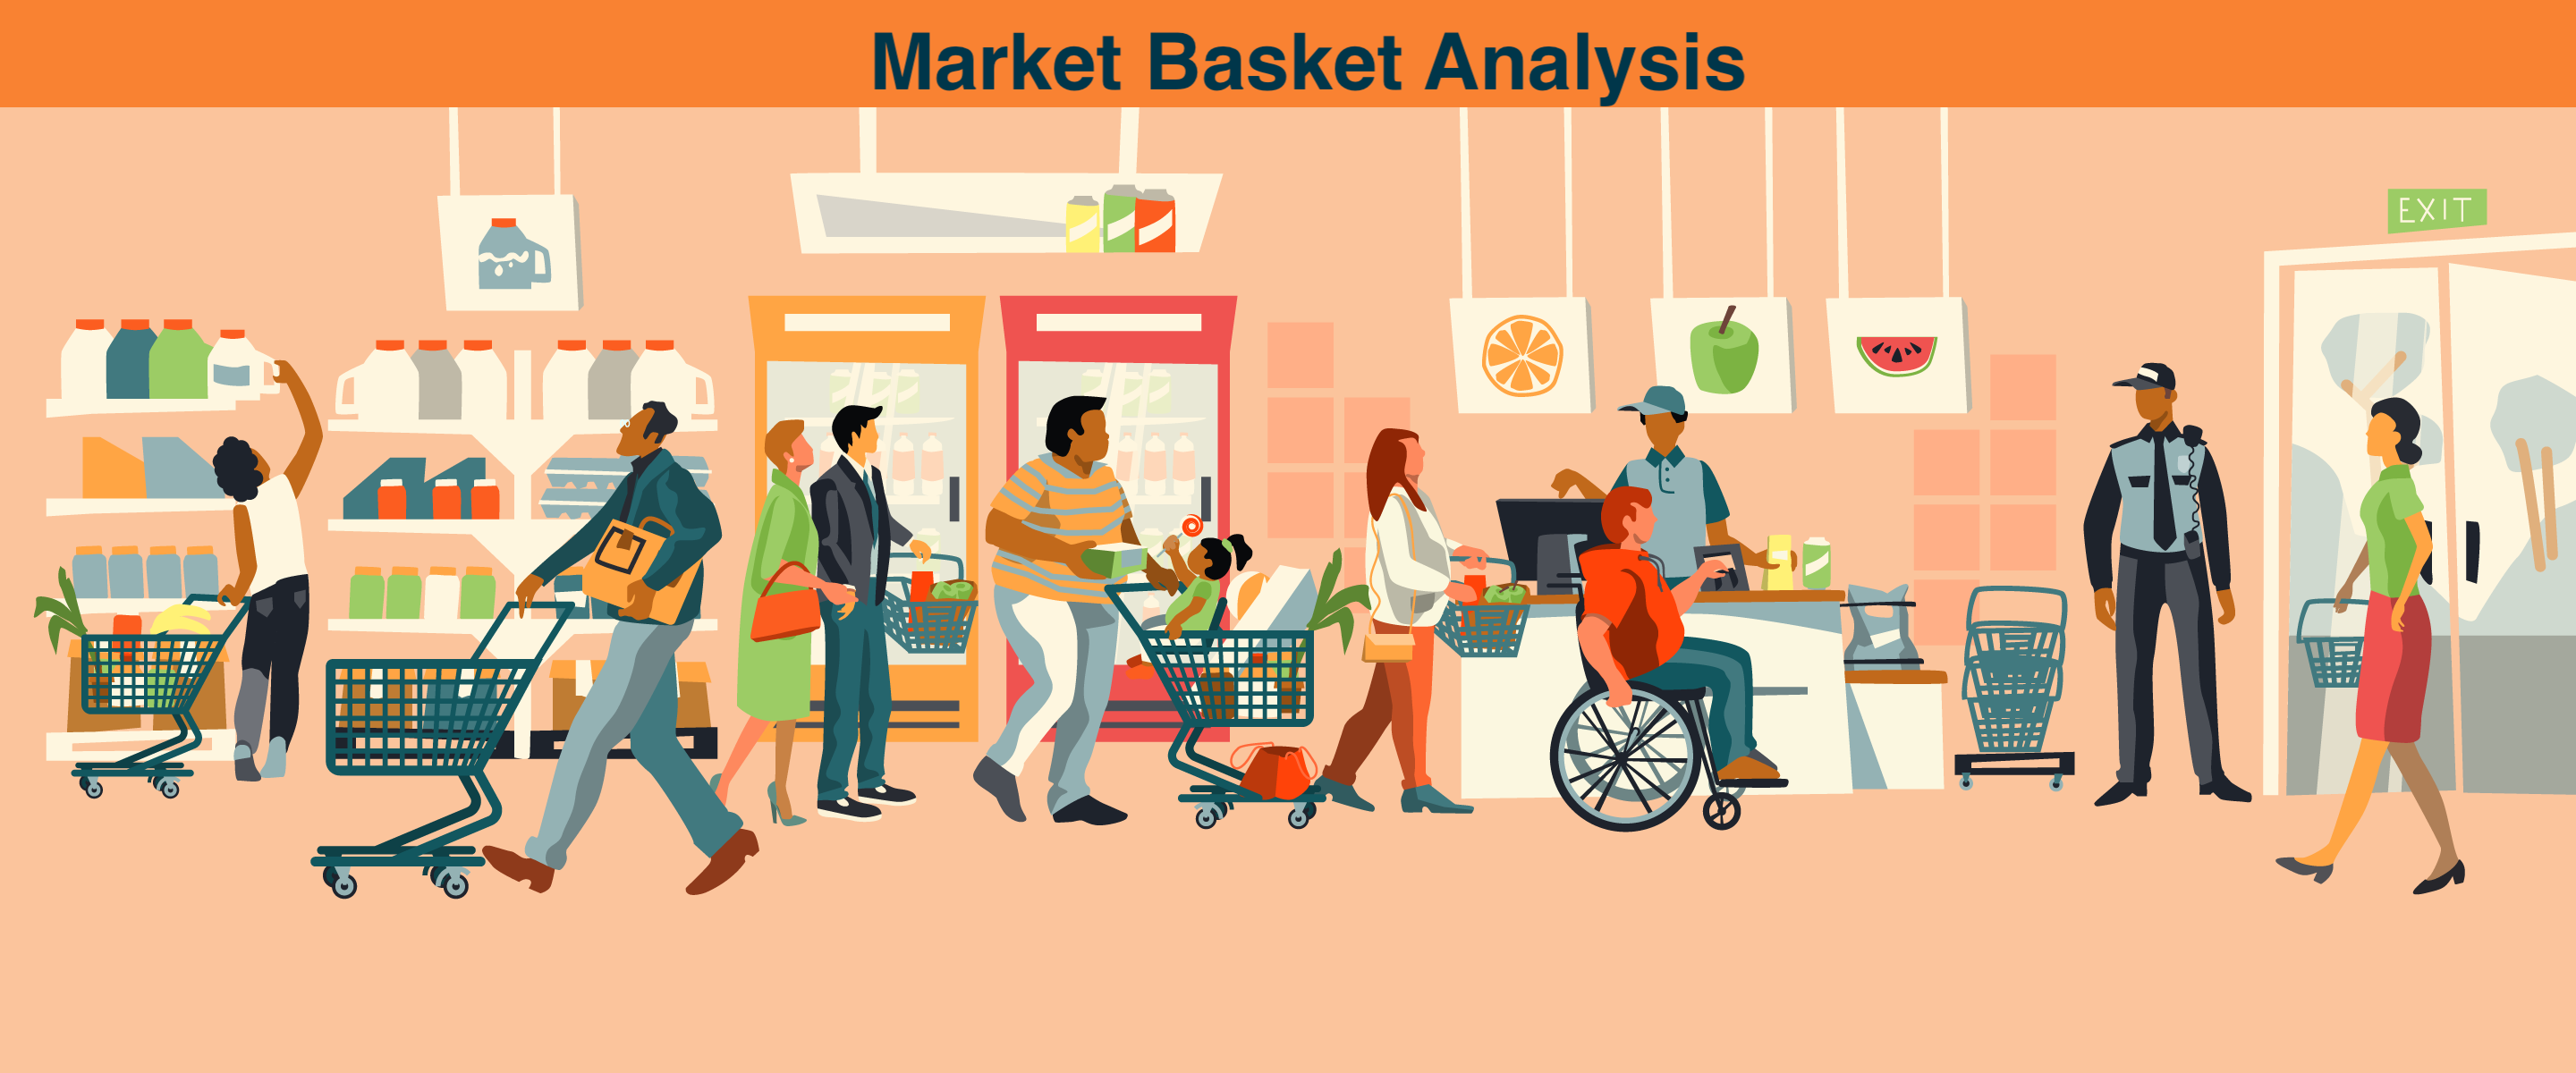
Market Basket Analysis
In today’s world, after the very well known pandemic we had through, the e-commerce sector rose like the sun. With this raise, websites of almost every brand from relatively small businesses to the largest businesses have gained a lot more popularity and their traffic has increased almost 50%. According to the International Trade Administration (2021), an average of 19% increase in e-commerce revenue is forecasted (26% in Food & Personal Care products) after the pandemic.These growth statistics and developments tell us one significant thing that the businesses should start to give more attention (and more budget) to their e-commerce/marketing departments and their operations. When e-commerce is mentioned, the first thing that comes to mind is obviously websites. Products are being tried to be exhibited in websites in such ways that help business owners to sell more products and gain more revenue from their most valuable resources which are customers. There are tens of ways to take the attention of customers and give them the intent of simply buying more. In this article, I will try to explain a method called “Basket Analysis”.What is Basket Analysis?Basket Analysis is a method that research and study on the baskets (carts) of customers in the website and analyse them to offer meaningful and customised product suggestions to the customers. Before getting through to the technical part of the analysis, there are some more things that we should better mention. Every customer is different as well as their purchase behaviour. Every product is different. However, some of them are used and bought together. In some situations, very unrelated products are sold together and human eyes sometimes cannot determine these ones. Exactly here, artificial intelligence and machine learning enter the stage.Let’s dive deeper into algorithms.Apriori AlgorithmThe Apriori algorithm has been in our minds since 1994 and it helps us find frequent item sets in a dataset for boolean association rules. Name of the algorithm is Apriori because it uses prior knowledge of frequent item set properties.In this algorithm, as mentioned above, the dataset must include products that are frequently bought. The data we need to apply this algorithm includes the following columns: Transaction ID (Basket ID) Product SKU (Product ID) Product Category Quantity After we obtain the necessary data, the magic starts.This algorithm can be written and applied by R Studio, Python etc.Since our data is breakdowned and thus has duplicate transaction ID’s, first we need to group the data by transaction ID and learn every distinct product that has been sold (obviously added to basket before the payment step) in that specific transaction.After this is done, we get dummy variables of all products and create new columns for each of them. For every unique transaction row, the quantity of the product is written to the cell of its own column and transaction. A sample processed data can be seen below:Transaction IDProduct AProduct BProduct CProduct D123abc7300456def2011Machine learning has its own rules, obviously. In order to analyse this data and have meaningful insights, we need to encode the cells into 1-0 to determine which product is added to the basket and bought in that specific transaction. The reason to do this is that Apriori Algorithms takes only 1 and 0 values to determine the association between products without any bias such as unrelated quantities. Consider that we are only interested in products that are being sold together.Finally, before we apply the model, we yield the below data:Transaction IDProduct AProduct BProduct CProduct D123abc1100456def1011We use the “frequent_patterns“ tool from “mlxtend” library and import “apriori” and “association_rules” packages to apply the model in an optimised and fast way.After the necessary parameters are adjusted in the model according to the specific dataset and specific purpose, we get the results as a table below:AntecedentsConsequentsAntecedentSupportConsequentSupportSupportConfidenceLiftLeverageConvictionProduct AProduct B0.40.60.50.832.780.0221.67Product AProduct C0.40.30.450.652.110.11.12Product BProduct D0.60.50.50.621.98-0.321.43Note: Values are randomly generated due to privacy issues.Results:OK. But What do they Mean?Here, the most important metrics that we should consider are “support” and“confidence” values. However, you can read the explanations below for a better understanding. Antecedent Support: The rate of the presence of antecedent products over all. Consequent Support: The rate of the presence of consequent products over all. Support: The rate of presence of antecedent product and consequent product being together in basket over all. Confidence: The confidence rate of products’ being together in the same basket. Lift: Confidence over expected confidence. Leverage: The statistical independency rate of a specific basket according to including products in it. Conviction: Gets higher when the consequent product is highly dependent on the antecedent product. After we yield the result table, we can start to analyse the results. How we do this analysis is according to some statistical methods. We should determine a threshold value for the “confidence” metric and split the rows into two parts: Meaningful or Not.When the confidence value is more than the threshold value, say 0.6, we can conclude that this relationship between products is meaningful and customers frequently buy these products together. Where to Use these Results? Where to use these results is another challenge.Businesses usually use this information for suggestion algorithms and shelf design. For instance, Product B is suggested to the customer who has just added Product A to his/her basket because the confidence level of these products is higher than our threshold value. Thus, the possibility of customer’s missing, forgetting or just not being interested in Product B is decreased and thus, we are being able to direct the customer to buy Product A. Secondly, shelf design (product listing pages in our case) can be conducted and applied to our website according to the results. For instance, Product A and Product B are located near each other to remind customers that they can buy them together (because they generally do it, don’t they?!).Thirdly, campaign scenarios can be set up for customers. For instance, Product B is presented with discounted prices for those customers who add Product A to their baskets or simply buy them before. Last but not least, the results of this analysis can help the business owners and marketers to design their offline (physical) stores’ shelves. Just like the product listing pages in websites, stores shelves can also be designed in such a way that customers can see related and frequently bought products together. In these ways, sale amount, order amount, revenue, traffic that website gains and key performance indicators like these may be increased. Besides, product & marketing costs can be allocated according to the results.

Product Scoring Algorithm
You are curious about performance of your products. And also, you are worried about how you can manage your product scope to increase revenue. Here are the answers for all of your questions, check out our blog and learn about our product scoring algorithm.Common problems in product managementThere are a number of questions that professionals might have in their mind while evaluating their companies’ performance. And some of these questions are more beneficial when thinking about important actions to increase efficiency of products that are sold on websites, apps and marketing channels.Here are some “general” questions that each team might be curious about the answers to. Which e-commerce metrics should we focus on while considering inventory management? Which products are more valuable? How can we increase our revenue by having the same product scope? What should be our key metrics for optimising marketing campaigns of our products? How should we decide our product listing in our website or app? Yes, you are right! AnalyticaHouse Data Science & Insights Team have another magical algorithm that would be helpful for all mysterious questions above and more, which is Product Scoring Algorithm. In this article, we will be talking about the structure of this algorithm and applications of it in the digital marketing sector.How is the algorithm built?There are a lot of variants for product groups in each website and app differentiating based on various dimensions such as colours, sizes, product types, season/offseason, target genders, target age groups and so on. We would be able to analyse every detail of products and product variants thanks to the Product Scoring Algorithm depending on the depth of the data we have.The minimum data requirement for this analysis are transactional data of products and current inventory information of them. We are focusing on these metrics while analysing transactional data; number of purchases, total quantity, revenue, average price and so on. Of course, this analysis would be more interesting when we have user/session-based data. We would be able to add other important metrics such as product detail views, add to cart, # of buyers, # of users who look at the product, revenue/product detail views, transaction/product detail views and so on. These metrics can be grouped into parts according to results they show; Revenue supporting metrics : number of purchases, total quantity, revenue, average price, revenue/product detail views, transaction/product detail viewsMetrics that show customer interest : product detail views, add to cart, # of buyers, # of users who look at the product, revenue/product detail viewsMetric definitions number of purchases: Number of transactions Total quantity: Number of products that are purchased Revenue: Total amount of revenue Average Price: Average price of products revenue/product detail views: Revenue per product detail views for each product transaction/product detail views: Conversion rate (based on product detail views) add to cart: Total number of products that are added to cart # of buyers: Total number of customers who purchased related product # of users who look at the product: Total number of users who viewed related product Application of the modelThe algorithm can be applied to each product level and can bring insights for bigger picture and tiny details.The example below shows a category/product level for an e-commerce company; Level 1: Shoes/Bags Level 2: Shoes Level 3: Sneakers Level 4: X Brand’s Sneakers Level 5: X Brand’s White Sneakers Level 6: X Brand’s White Sneakers with Size:38 How is product score calculated?Product Scoring Algorithm is basically formed from two parts. The first part is based on calculating ratio of lower levels (eg. X Brand’s White Sneakers with Size:38) in totals of higher levels (eg. X Brand’s Sneakers) by using metrics that we discussed above, and we will explain this part by showing an example. The second part is dependent on current inventory information of products, and this part is very crucial when we take inventory management into account for short term and long term. Example above shows a product scoring calculation by using metrics add to cart and quantity sold in addition to instant inventory score ( if there is inventory it is 1 and if not it is 0). In this example distribution of level 6 in total of level 5 for add to cart and quantity sold metrics and inventory score are used as three multipliers of product score of level 6. After calculating the score of each row (each breakdown, for this example it is level 6), we calculate the score of the higher level ( in this example it is level 5 ). We take the sum of the score of all breakdowns for level 5 and as a result we have the total score of level 5. For example; for X brand’s White Sneakers the total score can be calculated as :0,0747 + 0,0245 + 0,0036 + 0,0028 + 0,0251 + 0,0000 = 0,131In this example X brand’s Black Sneakers has the highest score (0,193) and X brand’s Red Sneakers has the smallest score (0,071).How can we use the results?This analysis can be applied to all levels from bottom to top. And of course, this analysis can be enlarged with additional metrics that we talked about before and results can be calculated in more detail. In addition to that, we can change the importance of each metric in the calculation step of the product score by using Variable Importance Analysis which is another outstanding algorithm that our team improved. Last but not least, results of the analysis can be used for updating product feed automatically for marketing campaigns.
6 Reasons to Buy Media in November - AnalyticaHouse
Everyone knows that the November sales events, which even consumers who have never shopped online know well, hold special importance for both e-commerce brands and consumers. The Black Friday phenomenon, which began years ago in the U.S. and quickly took hold in our country as well, has extended beyond its original date (the last Friday of November). Seeing the potential of this period, brands with "bright" ideas have spread it before and after that date with various special days (11.11, Cyber Monday, etc.), turning the entire month of November into a month of deals in e-commerce. In just a couple of years, the term “Black Friday” has evolved into “Black November.” As you know, digital media channels outside the main performance marketing channels (Google, Meta, etc.)—such as Onedio, Ekşi Sözlük, Kızlar Soruyor, Admatic, Medyanet, Sahibinden.com, etc.—do not operate on a retargeting logic, and are therefore usually positioned in the user funnel for new user acquisition. Considering that new users on e-commerce sites typically make a purchase on their 7th–8th visit, expecting first-time visitors from these channels to complete a purchase in their first session (last click non-direct transaction) is not very realistic. In this article, we wanted to address the missed opportunities that arise when, looking at digital marketing activities as a whole, we focus too much on concrete metrics like ROAS and their primary inputs (search, retargeting, affiliate campaigns, etc.), while sidelining less directly measurable inputs like brand visibility and awareness. 1. Volume Problems in Performance Advertising In November, e-commerce brands of every scale are incentivized to run eye-catching promotions. Especially marketplace-based e-commerce brands (Trendyol, Hepsiburada, etc.) increase both their brand and performance marketing budgets to reach more people or drive existing users to shop. During this period, advertising slots on digital media channels see high demand due to the huge budgets of e-commerce giants. On the other hand, these channels prioritize selling inventory directly to brands that can purchase it outright; any unsold inventory is made available via Real Time Bidding (RTB) to Google and programmatic buying platforms. Therefore, brands relying solely on Google or programmatic display buys in peak season get stuck with lower-impact inventory. And because demand is high there too, they end up paying higher CPM or CPC to remain competitive in RTB auctions. 2. The Need for Extra Reach and Gain from Share of Voice As in traditional retail, clearance events in e-commerce make sense only if you bring in new customers. The discount model works by sacrificing margin to drive volume and maximize total profit. Therefore, performance marketers’ top priority must be to reach new users outside their core base during promotional periods. Thus, opening reach- and new-user–oriented display campaigns on Google, Meta, and other RTB platforms is necessary—but in November, due to the reasons outlined, their impact alone will fall short. 3. Visibility Loss and Ad Blindness in Performance Ads As noted in point 1, the most visible slots get sold direct, leaving lower-impact RTB inventory. Further, performance campaigns optimize for clicks or conversions, sidelining the creative impact of the banner itself—and thus any awareness benefits. 4. Rising Unit Costs and the Need for Alternative Channels Some non-performance platforms charge on a CPC basis. While more cost-effective than performance channels in normal times, in November they lose that edge due to high RTB bids. Thus, non-performance platforms become part of a holistic performance plan—Engageya, Medyanet, Ciner, etc., all offer CPC models. 5. Turning Increased Demand and Purchase Motivation into Opportunity Consumers tend to postpone non-essential purchases until big sale events—and casual browsers are more inclined to buy under the influence of heavy promotion. This “buying mood” benefits both big and small brands alike. 6. Indirect Performance Gains from Higher Brand & Campaign Awareness Performance ads target users most likely to convert, but brand campaigns raise overall awareness, strengthening later organic and paid performance. Regular media investment boosts search volume on Google, which yields the most valuable and cost-effective traffic for e-commerce. Google’s RTB rewards ads with higher click-through rates (CTR) by lowering their CPC. By positioning media buys as brand investments in November, brands can boost CTR, reduce CPC, and achieve lasting efficiency gains. In short, brand marketing and media buying become even more essential and effective in November. We recommend that all digital brands treat marketing holistically—balancing performance metrics with the brand awareness and positioning gains achieved in consumers’ minds.

test
HelloHelloHelloHelloHelloHelloHelloHelloHelloHelloHelloHelloHelloHelloHelloHelloHelloHelloHelloHelloHelloHelloHelloHelloHelloHelloHelloHelloHelloHelloHelloHelloHelloHelloHelloHelloHelloHelloHelloHelloHelloHello
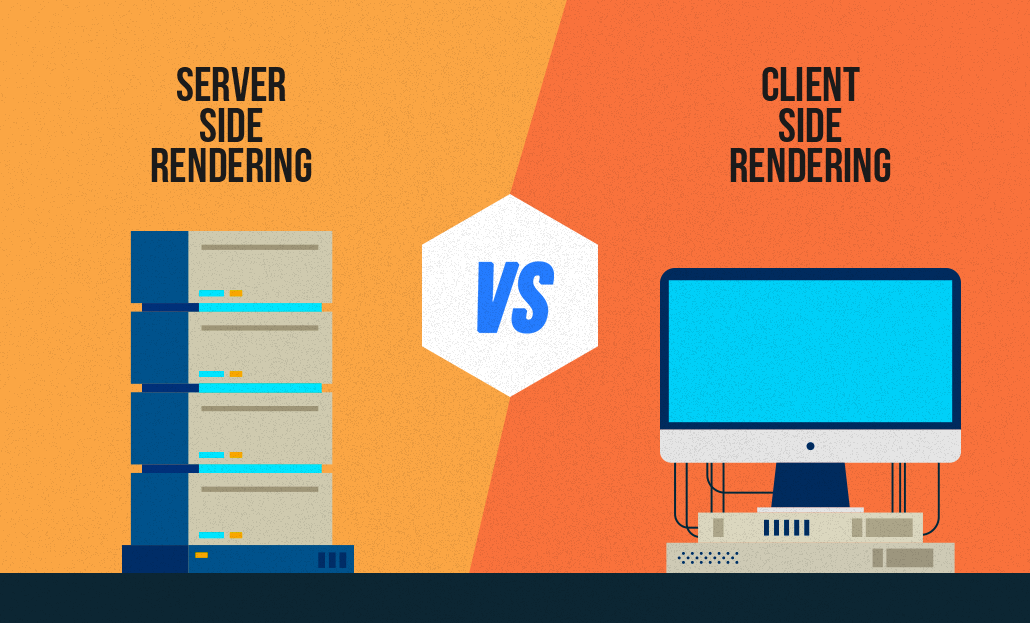
What is Client-Side Rendering (CSR) and Server-Side Rendering (SSR)?
All of the work done for search engine bots to better understand, crawl, and index sites written in Javascript is called Javascript SEO. Analyzing the complete crawlability of text, image, and video content is a top priority for SEO professionals. With the increase of websites written with Javascript, Javascript SEO studies have also started. Modern front-end libraries (React JS, Vue JS, Angular JS, etc.) have paved the way for a new study here. If we go much more fundamentally, as we know, web pages consist of 3 main parts. 1. HTML – We can think of it as the skeleton and content area of your website. A page consisting entirely of Html can give you information but does not offer an attractive design.2. CSS – CSS files that add visuality and design to HTML. Thanks to CSS, we can access the web page design we are familiar with.3. Javascript – It is the programming language that enables movable or changeable areas on a website. When you hover over an area, its color changes, or when you scroll the page, new content is loaded at the bottom thanks to javascript. According to the user's movement, Javascript files are run in the background and the final structure to be shown to the user is presented. With the developments on the software side, websites have recently started to be coded only with JS. Code lines are not presented individually in HTML, but are given directly over JS files. So, how well could Google adapt to these developments?Google & Javascript Relationship Google Javascript sites have started to understand and make sense of it much better in recent years. However, crawling sites written directly in JS is very costly for Google. Compared to a normal site, it both spends more time browsing and exhausts its servers. So what is Google doing to optimize this expense? Google uses a method called 2-stage crawling to crawl pages written in Javascript. In the first stage, Googlebot enters your site, scans the HTML and CSS, and adds it to its index. It also sees the Javascript files here but leaves it to the 2nd time to scan and understand them. In the meantime, it starts to show the results as far as the user sees in the first stage. It puts your site in a row within itself for 2nd wave scanning. This can take hours or days. It evaluates your site in order of its own priority based on its value and authority. When it comes to the 2nd wave, it also scans the Javascript files and adds them to the index. Thus, it starts to show the user the final version that you actually planned. How Is Javascript Different From Other Languages For Google? The browsers we use parse HTML, CSS, and JS through render engines. Therefore, it must be rendered first. Languages such as PHP and Python stand out as languages rendered on the server side. Alternatives such as Angular and React from languages coded with JS can be rendered with both Server Side Rendering (SSR) and Client Side Rendering (CSR) methods. How Does GoogleBot Crawl Javascript Sites There are 2 different methods for the correct crawling and indexing of sites written in Javascript by search engine bots. Client Side Rendering (CSR) (Including Dynamic Rendering) Server Side Rendering (SSR) Client-Side Rendering (CSR) The user or the browser of the search engine makes a request to your address. The server accepts the request and returns the response. The browser downloads the content and accompanying JS files. The browser executes JS files to view the content. The content becomes interactable by users and bots. Pros and Cons of CSR (+) Faster processing after first-page load (+) Puts less load on the server (+) Provides rich site interaction (+) Provides fast website navigation (fewer HTTP requests to the server as it doesn't have to be re-downloaded for every page load) (-) Slower loading of the first page (due to loading of assets required for multiple pages) (-) Delayed loading on devices with low processors. (-) Late loading when the internet connection is weak. (-) It negatively affects SEO if not implemented properly. (The page will appear blank until the Javascript codes are run and the content is created at the opening of the page) (-) External libraries are needed very often. Risks of CSR SEO Your page, which you have prepared using the most modern technologies, may appear as a blank page for Google. If you have a site written with modern Javascript libraries, frequently check how Google understands your site via the "Show Crawled Page" button in the URL Checking tool via Google Search Console. If your page is still not in the Google index, you can also test it on the live URL. Dynamic Rendering Dynamic Rendering is a method used for websites created in CSR to be SEO compatible. The main difference lies in offering different rendering formats to GoogleBot and users. When the server request is made, it is understood whether the request is made via GoogleBot or by the user on the server side. If rendered by GoogleBot, it returns an HTML response that will be rendered on the server. Users continue to view your site as CSR. Server-Side Rendering (SSR) The user or the browser of the search engine makes a request to your address. The server accepts the request, renders the entire HTML and returns the response. The browser downloads the generated HTML and JS files. The content becomes interactable by users and bots. Pros and Cons of SSR (+) Improves user experience by making pages load faster. (+) It is advantageous in terms of SEO. (+) It is a much more ideal structure for sites that offer static content. (+) Fewer JS dependencies are available. (+) Also ideal when the user's internet connection is slow. (-) When the server has a large number of visitors or the site is large, it can cause significant slowdowns in page rendering. (TTFB time may be affected) (-) It has to reload the whole page on each navigation. (-) Server costs will be high to provide higher performance.