

Marketing tips, news and more
Explore expert-backed articles on SEO, data, AI, and performance marketing. From strategic trends to hands-on tips, our blog delivers everything you need to grow smarter.

How to Prepare Your Brand for Black Friday in 3 Steps
The big November sales are starting! Is your brand ready for Black Friday? Follow these 3 steps to get the most efficient results for your brand during this hectic period.1. Plan Your Black Friday Campaign CalendarThe planning stage before Black Friday begins is crucial. First, define your campaign calendar and decide which audience you will contact, when, and how. You should create different strategies and plans for before, during, and after Black Friday.2. Forecast Your BudgetsTo make accurate forecasts, use tools like Performance Planner, Keyword Planner, and Google Trends, and review last year’s Black Friday data in Google Analytics. This will help you estimate more accurately and manage your budgets effectively.When planning budgets, consider all dynamics: media mix, channel distribution, brand and programmatic plans for maximum visibility, and include third-party channels in your plan.3. Divide Your Plans into PhasesHistorical data shows that shopping interest ramps up before November, peaks during Black Friday week, and then tapers off afterward. Therefore, split your planning into three phases: pre-sale, sale week, and post-sale.a) Pre-Black Friday PhaseBecause competition and costs spike during the sale week, start your campaign early to build awareness and expand your remarketing audiences. By driving traffic to your site before the sale at lower cost, you’ll have data ready to retarget more efficiently when costs rise.Be sure your promotional visuals and videos are ready well before peak week—dynamic creatives work best for awareness.Update your CRM segments with last year’s online and offline purchasers in Google Ads and Facebook, so you don’t miss any high-value customers.Also, ensure your website infrastructure can handle peak traffic: verify Google Tag Manager, conversion tags, and Facebook events before the rush.On the product side, check inventory levels and variety for your best-sellers and planned discount items to avoid stockouts during the surge.b) Black Friday WeekIn Google Ads, watch for “limited by budget” alerts—manual bidding campaigns can run out of budget quickly when volume spikes. Wherever possible, use automated bidding strategies to stay competitive.To broaden your reach, diversify campaigns: alongside programmatic and third-party buys, use Google Discovery, YouTube, and Dynamic Search Ads. Don’t forget to add all relevant ad extensions.On Facebook, build separate campaigns for awareness, consideration, and conversion, each with tailored messaging.Prioritize low-competition categories to avoid skyrocketing costs. In search campaigns, favor long-tail keywords over ultra-competitive terms like “Black Friday” or “Cyber Monday.”Launch new campaigns early so they finish learning before peak week. On Facebook, use Dynamic Creative; in Google Ads, use Responsive Display and Responsive Search Ads, with varied extensions.Traffic during peak week often stays for a while after. Segment users by behavior—e.g., abandoners—and set up a post-sale phase with special offers like “We Miss You” coupons for those who added to cart but didn’t purchase.c) Post-Black Friday PhaseSince sales taper off gradually after Black Friday, plan for a smooth transition. Prepare your post-sale creatives and messaging in advance.A common mistake is forgetting to pause sale campaigns afterward. Use automated rules in all platforms to turn off or adjust campaigns, and audit any leftover promotions from last season.

Are Your Remarketing Spendings As Effective As They Seem?
In digital marketing, especially in e-commerce brands, remarketing is carried out to accelerate the purchase (conversion) journey of users and to finalize their unfinished purchases.For remarketing, in addition to classic advertising platforms such as Facebook and Google, third-party platforms, which we will focus on in this article, are also primary tools.So how these third-party platforms work and how are they evaluated?Third-party platforms target users who have interacted with your site before and show them the products they viewed/added to their cart or the creatives preferred by the advertisers (campaign banners, etc.) in their contracted inventory (news sites, dictionaries, etc.). Thus, it aims to remind users of brands and products in various inventories and to complete the purchase journey of users.While evaluating these platforms, the ROAS (Return On Ad Spend) metric is primarily evaluated by using the last non-direct attribution model, usually through measurement tools such as Google Analytics, although it varies depending on preference.So what are these attribution models? Attribution models are methods that assign a share to each step that users interact with the site in their purchasing journey, according to its importance in purchasing, and thus enable us to evaluate the performance of interaction steps (channel, source, medium, campaign, etc.).The most used attribution models: In the Last Interaction attribution model, the last touchpoint would receive 100% of the credit for the sale. In the Last Non-Direct Click attribution model, all direct traffic is ignored, and 100% of the credit for the sale goes to the last channel that the customer clicked through from before converting. In the Last Google Ads Click attribution model, the last Google Ads click would receive 100% of the credit for the sale. In the First Interaction attribution model, the first touchpoint would receive 100% of the credit for the sale. In the Linear attribution model, each touchpoint in the conversion path would share equal credit for the sale. In the Time Decay attribution model, the touchpoints closest in time to the sale or conversion get most of the credit. In the Position Based attribution model, the credits of the interactions are allocated depending on the positions. For example, X% credit is given to the first and last interactions, while (100-2X)% credit is distributed to the middle interactions. ”(1) Among these attribution models, the model we will focus the most in this case will be the Last Non-Direct Click attribution model, which is also used by Google Analytics and the most used measurement tool in the world.We explained what remarketing is, how and with which tools remarketing is done, how the performances of third parties are evaluated and what are these attribution models. To summarize, one of our most important weapons in the purchase journey of users is remarketing, and we can do remarketing in many ways, we consider ROAS as the determining basis and we measure our results with Google Analytics. Google Analytics, on the other hand, uses the Last Non-Direct click attribution model, which does not consider direct traffic.Let's talk about why we are explaining these. We have examined two third party platforms, which are the most widely used in Europe and whose names you can recall by now. Based on all this information, you can be sure that the results will change your view of these advertising platforms.First, let's see if the conversions attributed to these two platforms are actually last click or are they written to these platforms because of the attribution model used, although the last interaction is a direct channel. We can use the "Direct Session" dimension in Google Analytics to look at this. This dimension tells us whether a sale came from direct or actually came from that channel's last click.When we examine the Direct Session breakdowns of these third parties, the result we see is extremely interesting.As can be e in the table, the rate of direct last click sales is 39% in Third Party B, while it is 19% in Third Party A.This means, for Third-Party A only 1 out of 5 purchases actually came directly from users who last clicked on this channel, while 2 out of 5 transactions for Third-Party B are truly last clicks.So, could the results be due to the proximity of users to the buying action, but not these platforms?To answer this question, we examined similar audiences on Facebook with the same method and showed that the results were due to platforms, not the funnel.The direct last click conversion rate of remarketing targeted ads on Facebook is 63%.So, for Facebook, actually 3 out of 5 purchases are coming directly from users who last clicked on this channel, which clearly shows the difference.Let's dig deeper into this analysis and look at the conversion path reports of these sales. These reports help us to see the interaction steps of each conversion journey and at what stage the relevant channel is positioned in these journeys.When we examined the transformations that included Third-Party A and Third-Party B channels by considering direct traffic, we saw that the results we encountered confirmed our hypotheses in this area.Back to the results, the rate of having a direct path before the third-party path in a user's purchasing journey is 62% for Third-Party A and 67% for Third-Party B, on average.In addition, the number of direct paths from each user's third-party path is 5.15 on average for Third-Party A, while this level is 6.46 on average for Third-Party B. This result actually shows us that these platforms target users who are prone to generating direct traffic and that these results are completely misleading.Well, before answering questions such as what should we do with this information or should we stop using these platforms, we recommend that you apply this analysis to your brand before making a decision, reminding that this analysis was made for a single brand. But you are likely to get a similar result :)As AnalyticaHouse, we remain to use these platforms and interpret the data correctly, and we perform our optimizations and evaluations in the light of this information.If you think it is very painful for you to analyze information at this level, then we are here for many advanced analyzes and applications. Then again, this is a very small part of what we can do!Once again, if you are taking actions just by looking at Google Analytics and your regular reports, you do not realize what you are missing. If you would like improve your current information about Google Analytics and this kind of technical issues we can give a recommendation to have a look at our React and GA4 content which can be very beneficial about this kind of technical things that has been mentioned in this articleReferencesOverview of Attribution modeling in MCF. Retrieved from: https://support.google.com/analytics/answer/1662518?hl=en&ref_topic=3205717
What is Google Travel Insights and How to Use it Effectively?
Google Travel Insights is one of Google's newest products. It opens the secrets of the travel industry by providing free insights with data on the basis of regions, countries and cities to users who want to follow the travel and hotel industry trends. With Google Travel Insights, you can track the change of interest and popularity level of users to travel destinations.What does Google Travel Insights do?Google Travel Insights is a free tool that reports regional changes in the Travel industry in channels where users have a chance to collect data from Google. With this tool, many of the insights sought in the Travel, Tourism and Hospitality industry are provided free of charge. For example, thanks to this tool, which regions of Turkey are popular when traveling from Germany to Turkey? While the popularity of which regions are increasing, you can see which regions are trending downwards, and you can shape your region-based investments accordingly in Digital platforms.How to use Google Travel Insights?You can access this free service provided by Google by clicking here. When you reach the page, two sections will welcome you. One of them and the tool that we will talk about in detail in this article will be the Destination Insights.As Destination Insights Google defines it "Explore how tourism demand is changing and how this year compares to previous years' demand.". In this tool you can explore how the Aviation and Hospitality industry is changing and transitioning of interest based and areas.In the interface, we choose the country in which we are curious about the distribution of interest volume. In the second step, if we are curious about the city-based data of a particular country, we select the country we want to select in the Dropdown titled Destination Insights. If we are curious about the global interest, we can leave this selection as Worldwide. In the third step, we choose the Travel Type, this selection is divided into two as domestic or international. In the fourth step, under the Demand Category heading, we choose Accommodation or Air. In the last step, we select the date range that you want to see the interest in. When you’re submitting, the distribution of interest is listed directly on the basis of region, country and cities.How to use Google Travel Insights in Ads?If you are managing an account in the Aviation, Tourism and Hospitality sector, you must have wondered about the change of interest on the basis of regions or how your investments will be shaped, and you have done many tests while creating your budget plans. In our Corendon Airlines’s accounts, which we provide Performance Marketing consultancy services, we often try to track our budgets, search interest to find the most appropriate budget allocation.After getting acquainted with the Google Travel Insights tool, we started to consider the data we obtained from the Google Travel Insights report, as well as the past CRM data, current search volumes and impression shares from our search ads. We also use the data we get from Google Travel Insights in our budget allocations, bidding management and our first market research in the countries when we expand our operation in new markets, using the data we get from this report and other reports which mentioned above.In addition, we can automate the reporting and account management processes thanks to the Web Scraper and Google Ads Scripts we have prepared. We can automate the reports I mentioned above with a scraper that we store on a server, and we use them effectively in campaign management with Google Ads Scripts.In your own accounts, you can discover new target markets from the data here, and shape your ads according to the insights from the Google Travel Insights tool.Ad Account Management with Google Travel InsightsAs I mentioned in the previous paragraph, we automatically process the data we receive from this tool in our Corendon Airlines account, monitor its changes on a weekly basis, and structure the keywords we target in Google Search campaigns with the insights we get from this report.For example, with the help of the data we get here and the Google Ads API, you can automatically add keywords to your Ad Groups, update your budgets, and update your bids. You can manage ad groups or keywords with Google Ads API Scripts. Therefore, you can edit and manage your ad texts and extensions with trending cities.You can combine the data you get from the Google Travel Insights report with your other reports and facilitate your campaign management with the insights you get.Final words for Google Travel Insights: Note that Google Travel Insights consists only of data gathered from Google’s data sources. Does not contain Social Media, TV or Market Research trends. Consider Google Travel Insights data as a data source that you can use in addition to the data you get from your accounts, sales-based CRM data, and other data sources, rather than just treating it as a single criterion. Country-based travel trends can change very quickly, we do not recommend you to use it as a decision maker for your daily actions. When evaluating all data, make sure you can read the data clearly. If you are not sure about the actions you will take, I recommend that you contact your digital marketing consultants. If you want to improve your accounts with automation solutions and focus on more marketing strategy and your customers with eliminating human-based errors, you can contact the AnalyticaHouse team.
What is Google Ad Rank?
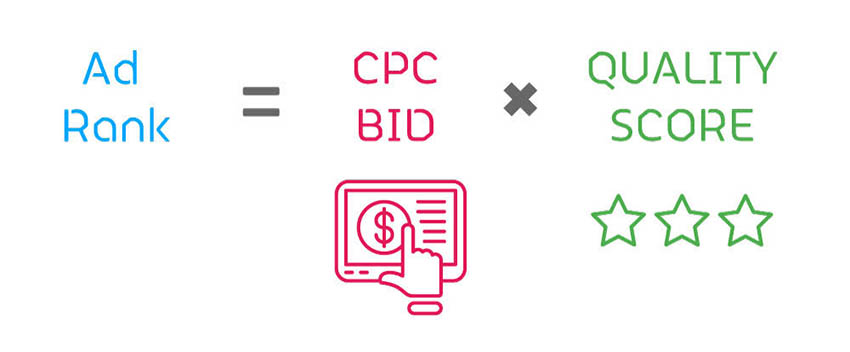
The Google Ads search network has become a critical point in the growth strategies of all brands. Especially small-medium size brands use Google Ads in order to get new users and retain users who have interacted with the brand before.Google Ads Search Ads is a pay-per-click ad type. In other words, advertisers pay when the user clicks on the ad, but they do not pay when the user does not click on the ad. Contrary to thought, Google Ads search ads do not get position on the search results page based on bid-per-click only. There are many factors that affect the positions, impression and clicks of the ads. It is necessary to examine the factors that enable Google to make search ads more fair.What is Ad Rank?As in all auctions, in Google's auction system, the person who wants to buy the product or service has to make a bid, but the advertiser with the highest Google Ad Rank is shown at the top, not the highest bidder.When users search on the Google search results page, the probability o clicking on ads which is above is much lower than the probability of clicking on the ads in listings below. So Ad Rank is of great importance in order to get impressions and clicks effectively and quickly, and to advertise by using the budget much more effectively.How can we calculate Ad Rank?The Ad Rank formula which was announced by Google is Bid x Quality Score = Ad Rank. Ad relevance, estimated clickthrough rate, landing page experience, and ad format are elements of Quality Score.Although Google has not explained the Ad Rank formula with all its signals, some of the factors it explains and the factors affecting Ad Rank by looking at the past experiences of the advertisers can be grouped under 5 main factors. Bid of Keyword Ad Relevance Expected CTR Landing Page Experience Extensions and ad formats In the example taken from Google's Ad Auction document, there are 2 impression slots and 3 advertisers. The quality score of all 3 advertisers was determined as the maximum score of 10. In this case, two questions arise that need to be answered; Which advertiser will rank above? How much will each advertiser pay per click?The answer to the first question is that the higher bidder, who is willing to pay more for that impression, will get an impression. In other words, Alice who bids $5 will be ranked higher than Bob who bids $3 and will receive impressions. In the second question, the method that Google uses as an auction method is called Second Price Auction. The biggest difference from First Price Auction is that instead of buying directly with the bid given by the highest bidder, the second highest bidder can buy that click by paying as much as the lowest monetary value. Looking at the above example with the formula Bid x Quality Score = Ad Rank, Alice gets 50 points and Bob gets 30 points. With the quality score fixed, Alice must pay a total of $3.01 to beat Bob and get the first ranked click.Looking at the above example with the Ad Rank formula, Alice got 50 points and Bob got 30 points. In this case, the advertisement given by Alice will be in the top ranking. Bob's ad will rank lower. But it wouldn't be fair for Alice to pay $5 for that show even though there was such a big difference. It can be said that Google is trying to give justice with the Second Price Auction. The minimum bid for Alice to exceed Bob's 30 points, when she gives $3.01 x 10, passes with 31 points and is ranked. Thus, he gets impressions and clicks by paying $3.01 directly, not $5.What is Quality Score and How to affect Ad Rank?Quality score is the most important of the two variables of Ad Rank. The main factor that enables the advertiser to get more impressions and clicks with lower costs is the quality score.Quality Score is an evaluation score displayed by Google on a system of 1 to 10 in the Ads panel. With 1 being the lowest and 10 the highest, Google scores the quality score on a keyword basis, and the bid given to the keyword related to the quality score determines the Ad Rank. In order to see the quality score metric, the relevant metrics can be added by going to the Search Keywords section in the Google Ads panel like Exp. CTR, Landing Page Exp and Ad Relevance.The quality score consists of 3 main components which are as follows; Landing Page Experience Ad Relevance Expected CTR Maximizing performance on these metrics will support the overall increase in quality score and will result in higher Ad Rank with lower bids and at the same time getting clicks at a lower cost.What are the Factors Affecting Ad Rank?Factors that affect Ad Rank are ad relevance, landing page experience, estimated clickthrough rate, and bid-per-click.Ad RelevanceAd Relevance shows how relevant the search is with the ad that the user will see on the search results page as a result of searching for the relevant keyword on Google. So, if the user searches for "Red Shoes" and sees an ad with the title "Nike Air max", this indicates that the user has not seen a relevant ad and the Ad Relevance score of the advertised keyword will be low.Therefore, Google Ads Search structures should be designed in such a way as to ensure that the user encounters the most relevant ad they can see. Campaigns, ad groups, keywords and ads should be put in a structure so that an ad with the title "Red Shoes" and content is displayed in the search for "Red Shoes" and an ad with the title "Nike Air max" in the search for "Nike Air max".Expected CTRExpected CTR is a score that Google gives to the estimated click-through rate after many reviews such as historical ad data, brand awareness, and the relevance of the ad and the site.Although it is not possible to increase the estimated click-through rate directly, it is expected that the estimated click-through rate will increase when you increase online and offline brand awareness and backlink strength.Bid of KeywordBid is the offer that you are willing to pay in order to get clicks on the keyword specific to the ad.It can increase indefinitely, starting from the minimum amounts determined by Google for each Keyword. So for 1 click, you can bid 0.10$ or 1000$, but the actual CPC value will depend on many factors such as ad rank, competition, and the ad rank of other advertisers.Landing Page ExperienceThe Landing Page Experience metric is also a frequently discussed metric in the SEO and SEM world. Google says that it measures this metric with 200 different signals, but today we will explain 3 main signals, both explained by the Google SEO team and determined by experience by Digital Marketing experts.1-) Ad Relevance with Landing PageSimply put, the ad that the user is looking for and the page he goes to must be relevant. As in the previous example, the first important metric to get a good Landing Page Experience score is that the user who clicks on an ad with the title "Red Shoes" as a result of a search for "Red Shoes" goes to a landing page where red shoes are sold or promoted. So how does Google Bot know that there are indeed Red Shoes products on that page?During the Google Ads Review ad, Google Bot goes to the site and first examines the Header, Title, Description and in-site links, which we call the Meta Tag. In this way, it makes a preliminary scan and makes sure that it sends the user to a site with "Red Shoe" products. Then, when the ad starts to get clicks from users and brings visitors, it continues to evaluate this relevance and revise its scoring with metrics such as session duration, bounce rate, conversion rate.2-) Mobile Friendly WebsiteEspecially with the increase in the use of smartphones, Google started to give more importance to the mobile performance of the sites rather than the desktop performance. Today, when the usage devices of an e-commerce site are examined, 80-85% of them are users who start a session with mobile devices.To briefly define Mobile Friendly sites, it is the general name given to the sites that are sized to fit the display on the user's mobile devices (tablet or smartphone) and that allow the user to navigate without the need to zoom or adjust the settings manually. Sites that are easy to read on mobile devices, navigate through the site, and find what the callers are looking for are mobile friendly sites. You can check whether a site is mobile friendly by using the Mobile-Friendly Test tool prepared by Google.3-) Landing Page SpeedLanding Page speed is one of the factors that are evaluated between 0-100 and should be evaluated in two separate ways as Mobile & Desktop. Depending on the device from which the search is made and the site opening speed on that device, the ad rank may change depending on the device. In other words, if the page that works very fast on Desktop works very slowly on mobile, it may rank higher in a desktop-based search, but may lag behind in mobile-based searches.You can use Google PageSpeed Insights, a free tool, and GTMetrix, which offers more advanced location-based results, to test this factor that affects both the ranking in organic results and Ad Rank.What Are Other Factors Affecting Ad Rank? User Search Term Users Location Search Time Device (mobile or desktop) In addition to all these, Google may choose not to show the ad if it considers that the ad will not be relevant to search, taking into account other ads and search results and other user signals appearing on the same page.How to Increase Ad Rank?Ad rank; It is a metric consisting of a quality score and a bid to keyword. In order to rank higher by keeping the bid stable, the quality score must be higher. In order to increase the quality score, three factors affecting it should be known in more detail.At the end of the table above are two different keywords with a quality score of 7 and 8. The reason for the 1-point difference in the quality score of these keywords should be examined. Above Average of expected click-through rate and ad relevance values for both keywords. However, in the landing page experience metric, a Keyword Average was evaluated, while the other keyword was Below Average. In other words, it shows us that the landing page of the ads where the 7-point keyword is shown is not good. What can be done to improve this quality score?It is possible to increase this score by sending the Landing Page to the most relevant link with the ad, optimizing the site opening speed, in short, by bringing the user to the experience they want as a result of the ad.If the problem was caused by Ad Relevance, it is suggested to increase the relevance by arranging the ad texts according to the targeted keywords, while if it is worth the estimated click-through rate, the level of brand awareness and relevance to the searched query should be increased throughout the site.It is very critical to establish effective campaign structures in order to make effective Google Ads Campaigns. With proper campaign structures, it is possible to generate more clicks and sales with paying less to one click.References Google Support – Ad Rank Practical Ecommerce – Google Ad Rank Impacts PPC Success Jellyfish – Google Ad Rank and How to Improve It