

Marketing tips, news and more
Explore expert-backed articles on SEO, data, AI, and performance marketing. From strategic trends to hands-on tips, our blog delivers everything you need to grow smarter.

How to Create Professional Reports with Looker Studio
In the digital marketing ecosystem, reading data accurately carries a much deeper meaning than just looking at numbers. Today, data visualization processes sit right at the center of strategic decision-making mechanisms. Looker Studio, formerly known as Google Data Studio, is one of the most powerful data analysis tools available to transform complex data sets into clear, interactive, and professional dashboards. In this guide prepared with AnalyticaHouse expertise, we break down how you can transform a performance report into a strategic asset and generate genuine value for your business.What is Looker Studio and Why Should You Use It?Looker Studio is a cloud-based business intelligence tool provided by Google that allows you to consolidate data from various origins into a unified panel. Especially within digital reporting workflows, the flexibility it provides eliminates the manual data-entry errors and severe time losses caused by legacy Excel spreadsheets. Looker Studio's reporting capabilities do not just visualize data; they actively assist you in discovering hidden correlations between distinct data sets.Rich Data Connectors: You can link directly to hundreds of different platforms, including Google Ads, GA4 dashboards, Search Console, Facebook Ads, and BigQuery.Accessibility: You gain access to a powerful data infrastructure to build enterprise-grade performance reports without paying high licensing fees.Real-Time Data Streams: Your data refreshes automatically, enabling you to trace the most up-to-date metrics and execute instant, agile decisions.Customizable Design: You can implement custom color palettes and corporate logos to craft reports that flawlessly match your brand identity.The Foundations of a Professional Report: The Planning PhaseBefore diving straight into the tool and building random charts, you must clarify your target audience and define the precise business questions the report needs to answer. Consider these three foundational pillars during an analytics dashboard project:Target Audience: Will the dashboard be evaluated by an internal SEO specialist or the CEO? Structure your data granularity accordingly.KPI Definition: Define which specific performance metrics benchmark success for your project (e.g., ROAS, Conversion Rate, Organic Traffic).Data Integrity: Verify that your underlying data streams (such as GA4) are configured correctly and that the data flows seamlessly without errors.Advanced Analysis via Data BlendingOne of Looker Studio's most impressive features is "Data Blending," which allows you to merge disparate data sources across a shared join key. For example, you can blend your advertising spend from Google Ads with corresponding revenue metrics from GA4 to view them side-by-side in a single table.Strategic Data Blending Scenarios:Omnichannel Marketing Matrix: Combine spend data from Facebook Ads and Google Ads to automatically calculate your true cross-channel "Cost per Lead" (CPL).Sales and Inventory Integration: Blend CRM backend databases with Google Analytics to rapidly identify which high-volume product pages are generating clicks but suffer from out-of-stock statuses.Budget Tracking Dashboards: Match target goals mapped inside Google Sheets against your live ad spend to keep budget utilization completely optimized.Professional Tip: Pay close attention to your "Join Key" configurations. When blending data sources, ensure you link them using fields that match perfectly in both sets, such as "Date" or "Campaign Name".Merging GA4 and Search Console: Building a High-Performance SEO DashboardThe key to a comprehensive SEO dashboard is bridging user behavior before they arrive at your site (Search Console) with the exact actions they take after landing on your pages (GA4). This holistic perspective reveals which organic keywords generate actual bottom-line revenue rather than just vanity traffic clicks.Step-by-Step Integration Map:Open a blank report in Looker Studio and add Google Search Console as your initial data source.Click "Add Data" and connect your primary GA4 dashboard property.Open the "Blend Data" workspace, placing Search Console on the left and GA4 on the right.Set "Landing Page" as your unified Join Key.This setup allows you to analyze organic search impressions and ranking data right next to conversion metrics on the exact same row.SEO Performance Dashboard MatrixMetric TypeData SourcePriority LevelStrategic PurposeImpressions & ClicksSearch ConsoleHighTracks your overall visibility share in SERPs.Average PositionSearch ConsoleMediumMonitors broad organic ranking movements and keyword trends.Session DurationGA4HighEvaluates on-page user experience and content quality.Conversion RateGA4CriticalMeasures the concrete commercial value driven by SEO.Driving Efficiency Through Automated Reporting ProcessesThe ultimate goal of reporting is not merely collecting data, but extracting rapid, accurate insights to drive business growth. Automating your digital reporting pipelines prevents your marketing teams from wasting valuable hours manually copying data every week. Looker Studio streamlines this workflow natively through its "Scheduled Email" features.Automation Best Practices:Email Delivery Scheduling: Program the platform to automatically distribute your primary dashboard directly to key stakeholders as a PDF every Monday morning.Dynamic Date Range Controls: Lock your reporting charts to rolling parameters like "Last 30 days" or "This month" so the dashboard is instantly up-to-date upon opening.Interactive Filtering Components: Embed dynamic date pickers and channel dropdown filters, allowing viewers to easily slice the data and interrogate metrics independently.Executive Presentation Logic: Storytelling with DataExecutives and clients rarely want to comb through thousands of lines of raw data spreadsheets. An executive-ready performance report must be built on a clear narrative framework: What happened, why did it happen, and what explicit actions are we executing next?Executive Dashboard Design ArchitectureIn a professional dashboard layout, always position high-level "Scorecards" right at the top of the viewport. These scorecards must showcase your 3 to 4 most vital core KPIs (such as Total Revenue, ROAS, and CPA) using large, easily readable text. Directly beneath, embed clean trendlines to illustrate performance trajectories compared to previous periods at a single glance.Map your presentation across three logical layers:Top Layer (Executive Summary): A high-level overview of global performance and goal completion metrics.Middle Layer (Channel Breakdown): Medium-level performance tracking segmented by specific channels (e.g., Google Ads vs. Paid Social).Bottom Layer (Granular Insights): Deep technical data paired with strategic action plans for the upcoming month.Looker Studio's Standings Among Core BI PlatformsWhile enterprise platforms like Power BI and Tableau deliver extensive analytical computing power, Looker Studio’s seamless, out-of-the-box integration with the Google marketing stack makes it uniquely indispensable for digital marketers. At AnalyticaHouse, we position this tool at a strategic junction to guarantee complete data transparency and provide real-time business insights.BI Tool Comparison OverviewFeatureLooker StudioPower BITableauLearning CurveFast and intuitive.Demanding steep training.Requires advanced data expertise.Google Stack IntegrationNative and flawless.Limited capability.Moderate capability.Licensing CostFree (With paid Pro tiers).License-based pricing.High enterprise costs.Sharing SimplicityVery practical (Via direct web links).Requires internal corporate infrastructure.Strict per-user license requirements.Conclusion: Construct a Data-Driven FutureExecuting professional reporting with Looker Studio represents more than a baseline technical skill; it proves how deeply you analyze your underlying business operations. From deploying initial GA4 dashboards to building multi-layered data blending models, you must focus intently on the narrative your metrics whisper. A properly structured performance report safeguards your marketing capital, exposes failing strategies early, and illuminates fresh growth opportunities.If you are ready to make your data arrays meaningful, moving away from complex, chaotic reporting rows to focus on high-fidelity insights, leverage the advanced data analytics capabilities of AnalyticaHouse. Remember, you cannot manage what you do not accurately measure; but with strategic data visualization, you can optimize, scale, and grow every facet of your business.

What is a KPI? Which Metrics Should Companies Track?
We all recognize the immense value of data in the modern business world. However, raw data remains a heavy burden for a ship that has lost its course unless it is properly processed and rendered meaningful. The foundational tools that allow you to understand how close your company is to reaching its strategic goals are KPIs (Key Performance Indicators), or Key Performance Metrics. Tracking the right metrics does not just measure your current success; it actively steers your future growth strategies.In this guide, prepared by AnalyticaHouse, we deep-dive into the concept of KPIs while sharing how to leverage the power of data analysis through industry-specific examples and how to safeguard your business against the frequently encountered trap of vanity metrics.What is a KPI? Definition and Strategic ImportanceA KPI (Key Performance Indicator) is a quantifiable metric that evaluates the performance of an organization, a specific department, or an individual employee in achieving distinct objectives. Placing KPIs at the center of your data analysis workflows transforms complex data streams into manageable, highly actionable insights. The most crucial point to remember here is that not every single metric qualifies as a KPI; a data point only acts as a KPI if it links directly to a strategic corporate objective.Establishing an effective KPI architecture forms the bedrock of your data-driven decision-making culture. By monitoring performance in real-time, you gain clear visibility into which specific business areas require scaling, which investments are yielding financial returns, and which active processes are dragging down operational efficiency. Securing professional analytics consulting is critical at this stage to guarantee your business goals map correctly and your tracking toolkits are structured without errors.The Risk of Misaligned MetricsThe most prevalent mistake committed during the KPI selection phase is attempting to measure everything simultaneously or fixating on easily retrievable data fields that fail to inject genuine business value. A poorly selected KPI can misdirect your teams' energy into inefficient areas. For example, if you evaluate a sales department exclusively on "the total volume of placed calls," your team members may shift their focus away from generating revenue to chase low-quality leads simply to inflate call counts. Therefore, when designing performance metrics, you must relentlessly evaluate whether the data directly serves your business's ultimate bottom-line success.Deconstructing Vanity Metrics: Do Not Mask Real PerformanceIn the realms of digital marketing and business analytics, one of the most sensitive items you must guard against is vanity metrics. These data points look phenomenal on paper and flatter your ego, but they do not actively contribute to your net profitability or sustainable growth trajectory.Total App Downloads: If users download your mobile application but never open it or delete it instantly, this figure is a total illusion. Instead, focus your tracking on Active Users (DAU/MAU).Social Media Likes: While likes serve as an indicator for broad brand awareness, they lack financial weight unless backed by a corresponding conversion rate.Raw Page Views: Accumulating millions of views on a website yields no strategic value if your visitors bounce rapidly and demonstrate zero meaningful on-site engagement.To capture real commercial success, you must focus heavily on "Actionable Metrics". These metrics deliver definitive answers to the question: "What explicitly do I need to modify?"Industry-Specific KPI BlueprintsEvery industry operates under its own distinct rules; consequently, your chosen performance metrics must be fully customized to fit your unique business model. The table below breaks down critical KPIs across three core sectors:SectorCritical KPIMetric DescriptionE-CommerceConversion RateThe percentage of web visitors who successfully complete a purchase.E-CommerceAverage Order Value (AOV)The average financial amount spent by customers per separate order.SaaS (Software)Monthly Recurring Revenue (MRR)The predictable monthly income generated through your subscription tiers.SaaS (Software)Churn RateThe baseline percentage of subscribers who cancel their accounts over a given period.Media / PublishingAverage Time on PageA core stickiness metric showing how engaging your content is to visitors.Media / PublishingAd ViewabilityThe percentage of served ad impressions that are genuinely seen by active users.Department-Level KPI BlueprintsTo reach your overarching corporate vision, every internal department must rigorously manage its own micro-KPIs. You can leverage the following frameworks when running department-level data analysis:1. Marketing Department KPIsYour marketing teams must focus their metrics on digital performance measurement and brand engagement:ROAS (Return on Ad Spend): The exact revenue generated for every dollar deployed into paid media campaigns.CPA (Cost Per Acquisition): The net financial cost required to acquire a single new customer or qualified lead.MQL (Marketing Qualified Leads): The total volume of high-intent prospects captured explicitly through marketing operations.2. Sales Department KPIsSpeed and transactional efficiency sit front and center for sales operations:Sales Cycle Length: The average duration of time it takes for a prospect to advance from initial contact to a completed sale.Win Rate: The total percentage of sent business proposals or quotes that successfully close as won sales.Customer Lifetime Value (LTV): The projected total revenue an individual customer will generate throughout their active lifecycle with your firm.3. Customer Success KPIsMaximizing retention is the absolute engine driving your long-term organic growth:Net Promoter Score (NPS): The baseline index measuring your customers' natural willingness to recommend your brand to others.First Response Time (FRT): The average duration of time it takes for an agent to respond to an open support request.Retention Rate: The exact percentage of existing customers your business successfully retains over a specific timeframe.Digital Performance Tracking and User AnalyticsIn contemporary business analytics workflows, mapping your visitors' digital footprints forms the most valuable link in your strategic chain. User analytics enables you to observe how a visitor behaves from the second they land on your platform, which sub-pages capture their focus, where they stall, and why they pull out without checking out.When executing conversion rate optimization (CRO), looking solely at how many people completed a purchase is insufficient; you must focus intensely on why the remaining users chose not to buy. Methods like heatmaps, session recordings, and structured funnel analysis offer unparalleled qualitative insights during a data-driven decision-making process.The Role of Business Intelligence and Analytics ConsultingWhile many enterprises collect massive quantities of data, transforming that data into a strategic competitive advantage requires deep technical specialization. Business analytics aims to evaluate historical metrics to accurately model and forecast future market trends (Predictive Analytics). Establishing the correct underlying data technology stack (GA4, BigQuery, Tableau, etc.) and maintaining clean data processing pipelines is absolutely vital across this workflow.Partnering with expert analytics consulting services gives your business definitive advantages:Ensuring your active KPI sets map in flawless alignment with your overarching business targets.Condensing complex multi-layered data arrays into simplified, automated executive dashboards.Eradicating structural tracking errors and keeping data clean and free of noise.Uncovering high-fidelity insights that systematically maximize your media Return on Investment (ROI).Conclusion: Construct Your Growth on Measured MetricsThe answer to what a KPI is goes far beyond a dry technical measurement unit; KPIs function as the literal road signs pointing toward your corporate vision. Isolating actionable metrics, avoiding the allure of vanity indicators, and running rigorous department-level analysis will position your brand multiple steps ahead of the competition. Data analysis is not a one-and-done project; it is a living cycle that must be continuously fueled and optimized.If you are ready to maximize your digital performance, draw deep insights from user behavior, and establish robust data-driven decision-making frameworks, explore the specialized capabilities of AnalyticaHouse. Let’s align your data with the right strategy to accelerate your business's growth journey.
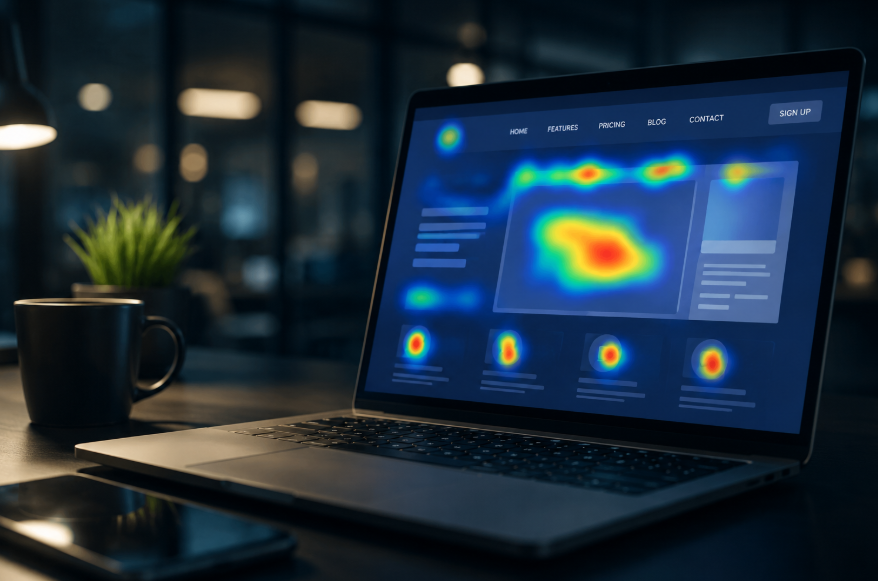
Do Heatmap Tools Really Work? The Power of Data in User Behavior Analysis
In the world of digital marketing and website management, the "data-driven decision-making" process is no longer a luxury—it is a fundamental necessity. However, the quantitative metrics you obtain through traditional analytics tools often fall short of explaining why users behave in a certain way on your website. This is exactly where heatmap tools enter the equation. So, are these visualization tools really as effective as claimed, or are they merely visual illusions consisting of colorful charts?Let’s explore the role of heatmaps in user behavior analysis workflows, their unbreakable bond with UX analysis, and their strategic importance within CRO tools. We will take a close look at the technical details of how insights provided by industry-leading platforms like Hotjar and Microsoft Clarity can transform a website's performance.What is a Heatmap and How Does It Work?A heatmap is a data analysis method that visualizes user interactions on a web page using a color spectrum—typically moving from cold blues to hot reds. These tools track your users' clicks, mouse movements, and page scroll depth through JavaScript code snippets. The resulting raw data allows you to cleanly discern which regions of your page are "hot" (receiving high engagement) and which areas are "cold" (ignored).You can evaluate heatmaps across three core categories within user experience optimization frameworks:Click Maps: Displays exactly where your users click on the page.Move Maps: Tracks where users move and hover their mouse cursors; this data typically shares an 80-90% parallel with eye-tracking studies.Scroll Maps: Analyzes how far down the page your users scroll.Scroll Depth Analysis: Is Your Content Actually Being Read?One of the greatest misconceptions you can fall into as a website owner is assuming that if you produce high-quality content all the way to the bottom of the page, users will naturally reach it. Scroll depth analysis enables you to test this assumption with real-world data. It is crucial to remember that most users spend the vast majority of their time "above the fold"—the initial part of the page that loads immediately without scrolling.What exactly does scroll depth data tell you?Strategic Positioning of Critical Info: If your primary "Call to Action" (CTA) button is located at the 70% mark of your page, but only 10% of your users scroll down that far, you are suffering a massive loss in conversions.Content Stream Friction: If you spot a definitive drop-off point where users abandon the page in bulk, it usually indicates a dry or unengaging visual or text block pushing them away.Mobile vs. Desktop Variance: While mobile users are generally more accustomed to scrolling, their attention spans are shorter. Scroll maps clarify these behavioral variances between device segments.Rage Click Examples: Why Are Your Users Getting Frustrated?One of the most striking outputs of combined heatmap and session recording features is the detection of rage clicks. A rage click occurs when a user repeatedly and rapidly clicks on a specific spot on your website within a short time frame. This behavior is a clear distress signal indicating user frustration or a technical glitch.Real-world examples of rage clicks you may encounter include:Non-Clickable Visual Assets: A user expects an image to enlarge or redirect them to a product detail page when clicked. If the asset is static, they tap repeatedly in frustration, wondering why it won't open.Unresponsive or Slow-Loading Buttons: When a user hits a "Buy Now" button and the page fails to respond instantly, they assume the system missed the command and mash the button. This frequently results in duplicate transactions or backend error messages.Misleading Design Elements: When users mistake underlined or uniquely colored text blocks for a hyperlink, they execute angry clicks when the element fails to navigate anywhere.Analyzing these behavioral friction points must sit right at the top of your data analysis action lists. Minimizing rage click rates directly correlates with elevated customer satisfaction and trust in your brand.The Critical Synergy Between UX and Conversion Rate Optimization (CRO)Just because your website looks aesthetically beautiful does not mean it is functionally successful. While UX analysis measures the structural usability of a design, CRO tools evaluate whether that usability effectively translates into a commercial outcome (such as a sale or a completed form). Heatmap tools serve as the ultimate bridge between these two disciplines.Analysis TypeUX ContributionCRO ContributionClick MapsMeasures navigation ease and spatial intuitiveness.Tests the explicit effectiveness of primary CTA buttons.Scroll MapsDetermines baseline readability and content hierarchy.Reveals whether key offers are positioned in optimal viewports.Session RecordingsDetects technical bottlenecks, bugs, and user obstacles.Uncovers the specific friction points causing checkout cart abandonment.As highlighted across performance marketing best practices, launching a CRO campaign without proper user experience optimization is like building a house without a foundation. Heatmap data pinpoints exactly where a problem exists, and you resolve it through UX modifications to drive up conversion metrics.Hotjar vs. Microsoft Clarity: Which Tool Should You Choose?While the market offers various user behavior analysis toolkits, Hotjar and Microsoft Clarity stand out as the most prominent alternatives. Both solutions offer distinct, specialized advantages.HotjarHotjar is a pioneer in the user behavior analysis landscape. Beyond traditional heatmaps, it allows you to capture qualitative data directly from your users through integrated surveys and feedback widgets. Hotjar's strongest suit is its highly user-friendly reporting interface, which simplifies the process of making sense of complex data pools.Microsoft ClarityDeveloped by Microsoft, Clarity sets itself apart by being completely free with support for unlimited traffic volumes. Its native integration with Google Analytics is an exceptional benefit, enabling teams to merge quantitative and visual data onto a single interface. Specialized metrics within Clarity, such as "Dead Clicks" and "Quick Backs", deliver unparalleled user insights.A Real-World E-Commerce Case ScenarioImagine managing an e-commerce storefront and noticing that a prominent "Special Offers" hero banner on your homepage is receiving far fewer clicks than anticipated. Google Analytics can only tell you that the click-through rate (CTR) is low. However, by deploying session recording and heatmap tools, you uncover the following reality:Your users are scrolling down far enough to see the banner (Scroll depth is sufficient).The mouse cursor hovers over the asset frequently (Interest is verified).Users are actively clicking on the product images inside the banner, but the images themselves are not hyperlinked—only a tiny "View Product" button contains the active link (Resulting in rage clicks and missed interactions).Following this analysis, a simple UX adjustment—making the entire banner asset clickable—will directly maximize your conversion rates and net sales. This is the exact moment when heatmap tools prove they genuinely work.Conclusion: Heatmaps are the Compass of Data AnalysisIn summary, heatmap tools are not standalone magic wands. However, when decoded properly and paired with deep data from your primary analytics tools, they serve as the strongest compass for your digital strategy. They remain indispensable for uncovering on-site friction, viewing your platform through your users' eyes, and systematically erasing friction points.At AnalyticaHouse, we proactively integrate heatmaps and user recordings into our data-driven growth strategies. To unlock your website's absolute peak potential and build a deep understanding of your audience, making UX analysis and CRO toolsets a standard operation is vital. Assumptions can misguide you; actual user behaviors will always point you in the right direction.

Most Common Measurement Errors in GA4: How to Protect Your Data Accuracy
Since its introduction to the digital marketing landscape, Google Analytics 4 (GA4) has fundamentally changed our data collection and processing habits. However, the migration process from Universal Analytics (UA) and GA4's event-based architecture brought along numerous technical challenges. A misconfigured GA4 account does not just present you with flawed reports; it also leads to incorrect ad optimizations and wasted budgets. In this guide, we will analyze the most common analytics mistakes, data loss scenarios, and exactly how you can solve these tracking issues.At AnalyticaHouse, we have compiled our extensive experience handling GA4 errors and Google Analytics problems across hundreds of client accounts to help you improve your business's data health.1. Duplicate Event Tracking ProblemsOne of the most frequent errors encountered in GA4 architectures is duplicate event tracking. This occurs when a single action performed by a user (such as a button click or a form submission) registers in the analytics system two or more times.Factors Leading to This Issue and Potential Outcomes:GTM and On-Page Code Conflicts: Deploying tags simultaneously via Google Tag Manager (GTM) and directly inside the website's source code (gtag.js) leads to double-counting.Enhanced Measurement Clashes: Automatically capturing events like "Scroll", "Outbound Clicks", or "Form Interactions" within the GA4 panel while manually setting up identical triggers in GTM corrupts your data streams.Page Refreshes: In conversion configurations tracking simple thank-you page URLs, the event can re-trigger every single time a user refreshes the browser page.This flaw inflates your conversion tracking metrics and misleads your primary ad channels (Google Ads, Meta Ads, etc.) into optimizing based on artificial spikes. Consequently, your Cost Per Acquisition (CPA) metrics appear lower than they actually are, clouding your financial visibility.2. Cross-Domain Tracking OmissionsIf your digital operations redirect users from your primary website domain to a distinct external checkout portal or a third-party application, configuring cross-domain tracking is absolutely vital. Omitting this technical setup disrupts the continuous customer journey.Data Loss Scenario: Referral Exclusion IssuesFailing to implement cross-domain tracking causes your primary domain or native payment gateways (such as PayPal or stripe variants) to display in your source reports as "Referral" traffic. This triggers severe marketing attribution errors. The true origin of a conversion gets assigned to "your-own-site.com" or the payment processor rather than recognizing the initial "Google Ads" or "Organic Search" interaction. This ranks as one of the most destructive analytics errors, rendering your e-commerce tracking workflows completely non-functional.3. Faulty Attribution and Custom Channel Grouping ImpactsWhen allocating your digital marketing spend, you need absolute clarity regarding which specific channel yields a corresponding return. However, inaccurate event measurement actively skews data-driven attribution models.While GA4 utilizes a "Data-Driven Attribution" model as its default setting, the following configuration oversights heavily undermine its baseline machine learning accuracy:Inconsistent UTM Tracking: Deploying broken, mistyped, or non-standard UTM parameters across your ad URLs forces high-intent traffic directly into the "Unassigned" reporting bucket.Improper Session Timeout Windows: Setting session timeouts too short can kill an active session prematurely during intermittent user pauses, incorrectly assigning subsequent conversions to a fresh session source.Redirect Parameter Drops: Faulty server-side redirects that scrub URL queries clean during page changes erase the true traffic source, replacing it with a generic direct label.4. Technical Missteps in E-Commerce Tracking DeploymentsE-commerce tracking serves as the literal pulse of a digital retail platform. Because GA4 operates on an entirely unique data schema compared to legacy Universal Analytics, the migration phase must be executed with extreme technical care.E-Commerce Tracking Error & Solution Matrix:Error TypeStrategic ImpactResolution StrategyMissing ParametersProduct-level metrics and item reports display completely empty fields.Mandate the strict collection of item_id, item_name, and price parameters.Currency MismatchesGross revenue calculations display distorted or over-inflated figures.Ensure the currency variable passes seamlessly in the correct format within your DataLayer.Transaction ID OmissionsThe exact same completed order double-counts across multiple refreshes.Pass a completely unique, non-replicable transaction_id string for every separate checkout order.Failing to properly trigger the standard purchase event within your GA4 event tracking framework makes calculating your actual marketing Return on Investment (ROI) mathematically impossible.5. Deconstructing Data Loss Scenarios: Why Your Metrics Don't MatchIn specific instances, the numbers logging in your analytics dashboard may fail to align with your internal CRM backend or raw sales databases. These are the real-world data loss scenarios you must guard against:Consent Mode Misconfigurations: Under privacy frameworks (like GDPR or KVKK), dropping non-essential tracking cookies without explicit user confirmation is prohibited. If Consent Mode is poorly integrated, the data streams of users opting out vanish entirely. Implementing Advanced Consent Mode allows GA4 to bridge these tracking gaps safely using behavioral modeling.Neglecting Data Retention Settings: Out-of-the-box, GA4 sets its user and event data retention timeline to a mere 2 months. If you fail to manually adjust this parameter to 14 months inside your property settings, you will experience severe data erosion when running historical deep-dive explorations.The Thresholding Phenomenon: If Google Signals is toggled on inside a property that experiences low baseline traffic volumes, Google will automatically withhold specific demographic data segments from your reports to guarantee individual user anonymity. This is a built-in privacy protection mechanism, but it can complicate niche data parsing if misunderstood.6. GTM Configuration Gaps and Debugging OversightsA centralized Google Tag Manager container forms the command deck of your measurement strategy. However, failing to optimize your GTM workspace bogs down frontend page speeds and sparks erratic tag firing.The Most Prevalent GTM Mistakes Include:Overloading containers with massive, legacy custom HTML scripts that slow down browser rendering times.Constructing overly generic trigger rules that accidentally capture unintentional page actions.Publishing workspace changes directly to a live production environment without validating streams via Preview Mode.Mapping improperly named DataLayer variables that fail to capture backend parameters.Executing complex GTM deployments without structured analytics consulting workflows consistently pollutes your marketing databases with structural data noise.7. The Ultimate High-Performance GA4 Audit ChecklistTo systematically verify the tracking health and measurement integrity of your digital infrastructure, run through these diagnostic steps regularly:[ ] Leverage DebugView Natively: Never assume an event configuration works until you monitor its parameters registering in real-time within the GA4 DebugView stream.[ ] Isolate Internal Team Traffic: Implement robust IP filters to exclude your corporate offices, developers, and agency partners. Failing to filter internal traffic distorts your baseline engagement metrics.[ ] Monitor "Unassigned" Volatility: If the "Unassigned" traffic share climbs past 10% in your acquisition tabs, audit your global redirect patterns and UTM naming taxonomy immediately.[ ] Restrict Key Event Scope: Remember that not every interaction deserves equal weight. Reserve your primary "Key Event" (Conversion) designations strictly for transaction-ready milestones like completed purchases or qualified lead forms.Conclusion: Constructing Growth on Clean DataThe key to winning in digital performance marketing is maintaining complete faith in the numbers driving your media spend. GA4 measurement errors and faulty event structures push teams into making flawed strategic assumptions, draining budgets into inefficient buckets. From cross-domain linking to granular e-commerce tracking parameters, every single pixel node must be configured with surgical care.If you maintain any doubts regarding the absolute validity of your digital metrics, exploring comprehensive analytics consulting is the definitive step toward modernizing your measurement infrastructure. At AnalyticaHouse, we eliminate technical roadblocks across your tracking pipelines to ensure you extract high-fidelity business insights. Remember, making decisions based on misconfigured data is significantly more dangerous than flying with no data at all. Turn off the guesswork—clean up your data streams today.
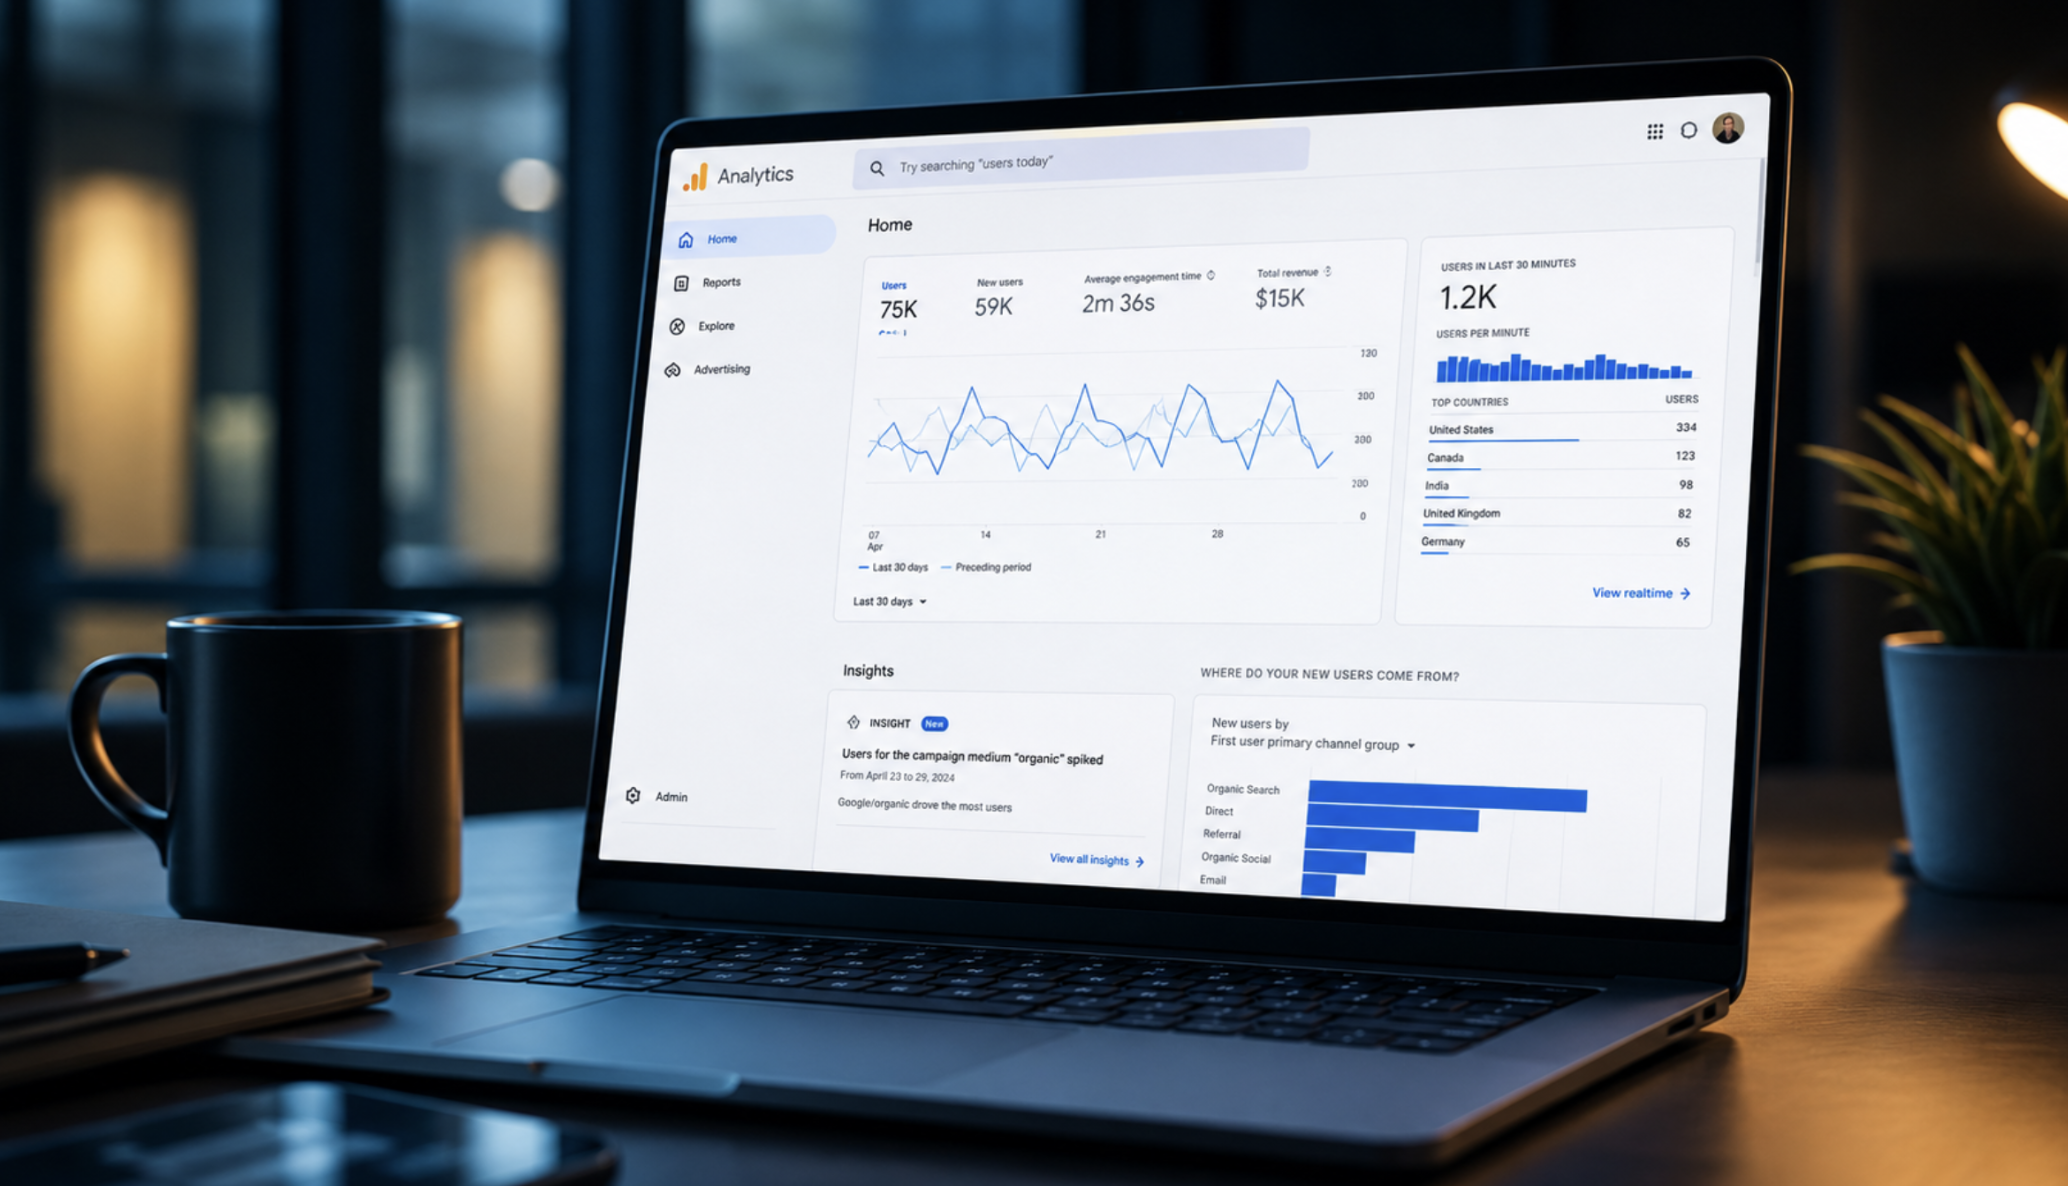
What is GA4? A Brand's Guide to Google Analytics 4
The digital marketing ecosystem has entered a brand-new era where user privacy is paramount and data collection methodologies are continuously evolving. At the center of this transformation sits Google Analytics 4 (GA4), which has fundamentally revolutionized how businesses measure their web and application traffic. In this comprehensive guide, we will deep-dive into what GA4 is, its setup workflows, the core differences separating it from Universal Analytics, and the strategic advantages it offers to your brand.What is Google Analytics 4 (GA4)?Google Analytics 4 is the latest generation web analytics platform developed by Google. Replacing legacy Universal Analytics (UA) properties, GA4 introduces the capability to track not just websites but also mobile applications under a single unified property. The most defining characteristic distinguishing GA4 from its predecessor is its underlying data structure: it no longer processes data using a "session-based" model, but rather relies on a fully "event-based" architecture.Today, actionable user behavior analysis demands a structure capable of mapping complex customer journeys where users constantly hop across multiple distinct devices. Backed by sophisticated machine learning algorithms, GA4 acts as a robust data analysis engine that can intelligently fill tracking gaps and generate forward-looking predictive metrics. This technological leap translates into higher conversion rates and optimized return on ad spend (ROAS) for your business.Universal Analytics vs. GA4: Core DifferencesThe primary reason many marketers experience a steep learning curve during a GA4 transition is the total shift in the metric definitions and data models they relied on for years. The comparison matrix below outlines the critical structural variances between the two ecosystems:FeatureUniversal Analytics (UA)Google Analytics 4 (GA4)Data ModelSession-Based (Sessions & Pageviews)Event-Based (Events & Parameters)Cross-Device TrackingLimited (Device-centric tracking)Advanced (User ID and Google Signals integration)Privacy ComplianceIP Anonymization requires manual setupPrivacy-first by design (Supports cookieless tracking)Predictive AnalyticsNot availablePredictive metrics driven by machine learningBigQuery IntegrationRestricted to GA360 (Paid enterprise) tiersCompletely free for all platform usersAs the comparative data indicates, GA4 is not merely a superficial interface update; it is a profound paradigm shift. Within modern digital analysis frameworks, the question is no longer "How many pages were viewed?", but rather "Which explicit action did the user take, and under what specific context?"Demystifying the Event-Based Data StructureDuring the Universal Analytics era, a user's on-site interactions were segmented into disparate "hit" categories, such as page views, events, or transactions. In the GA4 universe, every single interaction registers as an "event". Even a basic page view is processed in the backend as an event named page_view.This highly flexible event tracking layout equips your brand with powerful analytics advantages:Parameter Richness: You can append descriptive details (parameters) to every event. For example, a video_view event can carry custom variables tracking the video title, its total duration, and the playback resolution.Custom Dimensions: You can easily map custom data variables specific to your precise business goals directly into the reporting interface.Holistic Customer Journeys: A user clicking a button, downloading a file, or submitting a form is evaluated under the exact same data hierarchy, creating a crystal-clear user path.GA4's event-centric model extracts data from static reporting grids and breathes life into it as an integrated ecosystem. Engineering a properly structured event plan forms the foundation of advanced GA4 consulting workflows.How to Set Up GA4: A Step-by-Step Implementation MapSetting up your GA4 architecture correctly is paramount to safeguarding the absolute integrity and long-term validity of your future business analyses. You can execute your initial setup using the following blueprint:Property Creation: Navigate to the "Admin" settings panel in your Google Analytics account and create a brand-new GA4 property.Data Stream Provisioning: Select the appropriate data stream matching your target platform—Web, iOS, or Android.Acquiring the Measurement ID: Once the data stream is provisioned, copy the unique tracking ID prefix starting with G-.Google Tag Manager (GTM) Deployment: We highly recommend using GTM to deploy your GA4 tags seamlessly. Create a "Google Tag" inside GTM and input your unique Measurement ID.Activating Enhanced Measurement: Turn on the "Enhanced Measurement" feature toggle inside your GA4 stream panel to automatically capture standard interactions like scrolling, outbound clicks, and site search queries without extra coding.Technical oversights committed during the initial tag configuration can corrupt data streams, leading to missing or distorted metrics. Investing in professional analytics consulting to perform a thorough deployment audit is highly recommended to protect the health of your long-term business tracking.GA4 for E-Commerce: Real-World Use Case ScenariosFor e-commerce digital platforms, GA4 displays phenomenal capabilities for mapping and decoding conversion funnels. Legacy e-commerce reports have been rebuilt into a far more elastic, deeply granular framework.To execute highly accurate e-commerce data analysis, you should actively track these foundational standard events:view_item: Triggers instantly whenever a user views a specific product detail page.add_to_cart: Measures user interest levels by tracking cart additions.begin_checkout: Signals the initiation of checkout phases; indispensable for diagnosing cart abandonment metrics.purchase: Monitors the ultimate macro conversion, capturing completed sales transactions along with total purchase revenue.An E-Commerce Case Example: If you are managing a digital fashion brand, GA4 enables you to look past basic transaction volumes to uncover which specific product colors or size variations are frequently added to the cart but subsequently abandoned at checkout. Armed with this data, you can optimize your seasonal inventory and supply chain logistics directly.Understanding Metric Variances Between UA and GA4A recurring question brands ask when evaluating data post-transition is: "Why do my historical session counts in Universal Analytics not line up with my new GA4 properties?" This statistical variance is expected and stems from entirely logical differences in platform calculation methodologies:Session Calculation Logic: In Universal Analytics, an active session was automatically terminated at midnight or whenever a user encountered a new campaign tracking parameter. GA4 sessions are completely unaffected by these specific scenarios, meaning you will naturally see fewer—but far more realistic—overall session counts in your GA4 dashboards.Defining Active Users: GA4 strictly prioritizes "Active Users" as its primary user metric, whereas Universal Analytics front-loaded "Total Users" across its native reporting tabs.Engagement Rate vs. Bounce Rate: GA4 calculates bounce rate using an inverse logic, defining it purely as the percentage of sessions that were not engaged. This fundamental shift in definition naturally causes baseline percentages to diverge.Attribution Architecture: GA4 utilizes a "Data-Driven Attribution" model as its out-of-the-box default, whereas Universal Analytics relied heavily on a rigid "Last Non-Direct Click" model.Securing Data-Driven GrowthData functions much like crude oil; it holds immense intrinsic value, but it remains functionally inert until it is refined. Harnessing the full power of GA4's complex yet highly rewarding architecture requires expert navigation. Partnering with data specialists for professional GA4 consulting ensures your event tracking and marketing measurement architectures are built soundly from the ground up.Comprehensive analytics solutions can empower your business through:Delivering deep technical audits alongside customized tracking and measurement blueprints.Implementing server-side tagging architectures to bypass browser tracking limitations and eliminate signal loss.Engineering tailor-made Looker Studio dashboards to distill raw event strings into automated executive insights.Executing targeted conversion rate optimization (CRO) strategies powered by structured user behavior analysis.Conclusion: Construct Your Future on Verified DataGoogle Analytics 4 is far more than a basic reporting dashboard; it is a strategic compass designed to give deep meaning to your digital footprint. Through its advanced event-based architecture, integrated machine learning capabilities, and privacy-first engineering, GA4 has cemented its place as an indispensable pillar of modern digital marketing.If your brand has yet to audit its tracking accuracy, or if you maintain doubts regarding the validity of your current marketing metrics, securing professional analytics consulting is the definitive next step. Every strategic choice made without verified data is simply a guess. Stop guessing your business trajectory—build your future step-by-step on clear data insights.

How to Analyze SEO Performance with GA4
As one of the most dynamic areas of the digital marketing world, SEO has taken on a brand-new identity with the transition to Google Analytics 4 (GA4). Unlike traditional Universal Analytics (UA), GA4's event-based data model allows you to examine the user journey much more deeply. GA4 SEO analysis now goes far beyond simply counting clicks and sessions, enabling you to understand how visitors interact with your website and to what extent organic traffic contributes to your business goals.In this guide, prepared with AnalyticaHouse expertise, we will cover in full detail how to structure an SEO performance analysis process on GA4, the critical metrics you need to focus on, and how to measure the impacts of AI Overviews—the new reality of the modern SEO world.1. The Importance of Search Console and GA4 IntegrationTo begin a comprehensive SEO data analysis process, the first thing you need to do is connect your Google Search Console (GSC) data to the GA4 interface. Thanks to this integration, you can track users' behavior before they reach your site (queries, impressions, click-through rates) alongside their actions after arriving on your site (conversions, engagement time) all within a single panel.You can follow these steps to set up the Search Console analysis on GA4:Go to the "Product Links" section within the Admin panel.Select Search Console links and match your property.Once the link is complete, publish the Search Console reports using the "Library" tool in the "Reports" section.Once this connection is active, you can clearly see which keywords supply your most valuable organic traffic analysis data and which pages perform more efficiently in search engine results pages (SERPs).2. Organic Landing Page Analysis: Optimize User Entry PointsThe success of your SEO strategy depends directly on which pages users land on via organic searches and how much time they spend on those pages. Landing page analysis reveals which of your content pieces are deemed authoritative by Google and how effectively you satisfy user intent.To examine organic landing pages in GA4, navigate to "Reports > Engagement > Landing Page". Utilizing the "Session Source / Medium" filter here to focus exclusively on "google / organic" data will yield healthier analytical results.Key Metrics to Analyze for SEO Performance:Average Engagement Time per Session: Demonstrates whether your content effectively meets user expectations.Key Events (Conversions): Helps you measure the actual commercial value driven by your organic traffic.New Users: Reveals your website's potential to reach entirely new audiences.If you have pages that receive high traffic volumes but suffer from low engagement times, you must re-evaluate them from a technical SEO or content quality perspective. Securing professional analytics consulting at this stage plays a critical role in helping you identify hidden anomalies within your data sets.3. Relationship Between Engagement Rate and SEO: Moving Beyond Bounce RateThe traditional "Bounce Rate" we were accustomed to during the UA era has been replaced in GA4 by a much more meaningful metric: "Engagement Rate". In the SEO world, this shift represents a true revolution for measuring user experience. In Google Analytics 4 SEO strategies, a user's session is counted as an engaged session if they stay on your page for more than 10 seconds, trigger at least one conversion event, or view at least two pages.When conducting user behavior analysis, identify pages with declining engagement rates and ask yourself the following questions:Is page load speed frustrating the user? (Core Web Vitals impact)Does the content truly align with the targeted keyword's intent?Are the internal linking structures or visual assets sufficient to keep the user engaged?4. Measuring AI Overview Impacts: The New Frontier of SEOGoogle's generative AI-driven search results, known as AI Overviews, have pushed SEO performance analysis beyond conventional methodologies. Users can now read a summarized text generated by AI before ever clicking through to a website. While this shift can lead to organic traffic drops for informational queries, it also introduces premium, high-quality traffic opportunities by citing your site as a referenced source.You can utilize the following methods to indirectly measure the impacts of AI Overviews via GA4:Query-Based Analysis: Closely monitor the click-through rates (CTR) of informational queries within Search Console. If you detect drops where AI Overviews are highly active, optimize your content into a "direct answer" format that AI models can easily reference.Branded Traffic Monitoring: If AI engines recommend your brand as an authority, you can validate this impact by observing a steady lift in your direct brand search queries.Exploration Reports: Build custom timelines to compare traffic fluctuations on specific pages against major AI Overview rollouts to accurately analyze the underlying correlation.5. Creating a Custom SEO Dashboard: Make Sense of Your DataStandard out-of-the-box reports can sometimes lack the clarity required for complex tracking. Because of this, engineering a custom SEO dashboard allows teams to monitor overall project health at a single glance. The "Explore" section in GA4 is ideal for constructing free-form data tables and funnel analyses.We highly recommend including the following reporting components inside an effective SEO performance analysis panel:Organic traffic trends segmented by custom channel groupings.The top 20 organic landing pages driving the highest traffic volumes.A clear device-category comparison (mobile vs. desktop) of your organic performance.E-commerce revenue or form completion conversion volumes originating strictly from organic search.SEO Dashboard Visualization Matrix:DimensionMetricVisualization FormatFirst User Source / MediumNew UsersTimeline ChartLanding PageEngagement RateData TableDevice CategoryAverage Session DurationPie Chart6. User Behavior Analysis and Path ExplorationsSEO does not simply end once you attract organic traffic to your website; the true process continues by convincing that traffic to convert. The "Path Exploration" tool within GA4 allows you to trace the exact sequential steps an organic visitor takes after entering your site. For example, seeing whether a user moves to a commercial service page or directly to a contact form after reading a blog post carries immense value for your user behavior analysis.If visitors are dropping off rapidly following an organic landing, you can leverage "Content Grouping" features to isolate via SEO data analysis which specific categories (e.g., informational guides vs. transaction-ready product reviews) yield superior business results.7. Transforming Data into StrategyIn today's digital environment, GA4 SEO analysis is an absolute necessity for website success. You must go beyond merely watching the data; you need to decode its meaning and transform it into concrete, actionable steps. Every measure you take—from Search Console integration and engagement rate optimization to tracking AI Overview correlations and developing custom dashboards—will dictate your site's perceived value in the eyes of Google.At AnalyticaHouse, we are always ready to help you convert complex data matrices into strategies that serve your overarching business objectives. If you want to maximize your site's organic performance and create a definitive edge through in-depth analytics consulting, it is the perfect time to explore our professional solutions. Remember, you cannot improve what you do not accurately measure.