

Marketing tips, news and more
Explore expert-backed articles on SEO, data, AI, and performance marketing. From strategic trends to hands-on tips, our blog delivers everything you need to grow smarter.

Screaming Frog User Guide and Configuration Settings
If you want to learn what you can do before you start using Screaming Frog, one of the most frequently used tools by SEO experts, this content is for you.What Is Screaming Frog?Screaming Frog is a tool that scans your website by imitating search engines and allows you to see your website's shortcomings by listing important metrics for SEO. It was founded in 2010 by Dan Sharp. The most important difference from its competitors is that it is Java-based, not cloud-based, and you can install and use it on your computer.There are free and premium versions of Screaming Frog. While the restriction is 500 URLs in the free version, it allows unlimited browsing in the paid version. You can start using it by downloading it from https://www.screamingfrog.co.uk/seo-spider/#download.Obtaining and Activating a Screaming Frog LicenseIf you want to use the premium version instead of the free version, you must obtain a license from https://www.screamingfrog.co.uk/seo-spider/licence/ and enter this license in the tool you downloaded. After entering the user name and license number, you can start using your Screaming Frog program by closing and reopening it.Settings and Configuration OptionsMemory Allocation: Opens to 1GB for 32-bit and 2GB for 64-bit machines as the boot setting in Screaming Frog. If you customize and increase the amount of RAM here, it will allow you to crawl more URLs while in RAM mode.When browsing websites with many pages, you can manually adjust the setting here and increase it, with computers with high memory, you can finish your browsing faster and in a shorter time.Storage Mode: In this section about where the data you scan will be stored and processed, there are two options: Memory Storage and Database Storage. When the Memory Storage setting is selected, all data is stored in RAM, while when Database Storage is selected, storage is provided on the HDD/SSD.Memory Storage Mode is recommended for websites with fewer URLs and machines with high RAM.Proxy Configuration: If you want to use a proxy, you can make settings from this section.Language Configuration: Here you can set the language you want to use the tool in.Screaming Frog Mode SettingsSpider: In this setting, Screaming Frog bots will continue to crawl until they discover all URLs on the website you started crawling.List: This mode allows you to manually specify the URLs you want to crawl. It only scans the URLs you specify.SERP: It provides a preview of how the meta title and description tags of the pages you scan are reflected in the search results.Compare Mode: This mode creates your new scan by comparing it with the previous scan. In this way, you can more easily see which issues have been resolved.Screaming Frog Configuration SettingsSpider: You can select the areas you want or don't want to include before the crawl from the crawl area. You can specify what to exclude with the extraction field. You can configure the limit or depth of your scan in the limits section. You can change the render option in the rendering section to see the data correctly on your JS rendering site. In the advanced section, you can give directions about whether to consider tags such as noindex, canonical, and next/prev. In the preferences section, you can specify or change the pixel boundaries of your meta tags again.Content Area: In this area, you can check the analysis and grammar compatibility of the content on the site you will browse. Screaming frog considers content in the body of a page. It is recommended that you make customizations so that the tool can make more accurate interpretations on a website that was not created using HTML5 semantic elements.Content Duplicates: You can make your custom settings here to test the originality of the content on your site.Spelling & Grammar: Spelling and grammatical errors and the corresponding “Spelling” and “Grammar” options must be enabled for results to be displayed in the Content tab. In this way, you also provide these controls.Robots.txt: You can make the settings related to the crawling of the site you will scan without considering the commands in the robots.txt file in this crawl. You can also create a robots file yourself and have it scanned accordingly.URL Rewriting: You can specify the URLs that you do not want to see in the search results from this field. You can rewrite URLs in the URL Rewriting field. For example, you can reschedule the URLs with the Regex rules you apply to show the URLs with www as non-www or to see the URLs with the .co.uk domain extension in the .com domain extension and see them in the crawl results accordingly. Or, if you want to print your test site URLs, which are in a separate subdomain, as in your live site, this area will be very useful.CDN: The CDN tab is a feature you can use to make Screaming Frog see the URLs of your CDN service as internal links when browsing. After this adjustment, the links of the CDN address will appear in the "Internal" tab in Screaming Frog, and more details will be previewed.Include: The "Include" feature of Screaming Frog can be used when scanning for URLs that will be preferred on sites with a high number of URLs. For this feature to work, the URL from which you start the crawl must have an internal link that matches the regex, or Screaming Frog will not be able to crawl a second URL after the first URL. In addition, the URL from which you start scanning in Screaming Frog must also comply with your matching rules here.https://www.screamingfrog.co.uk/seo-spider/user-guide/configuration/#includeExclude: You can use this feature to exclude URLs, folders, and parameters that you do not want to be crawled while browsing. To exclude URLs from crawling, you need to use Regex language and write commands like this. The exclusions you apply here do not work on the first URL you start crawling on Screaming Frog. The Exclude setting applies only to other URLs discovered during crawling.https://www.screamingfrog.co.uk/seo-spider/user-guide/configuration/#excludeSpeed: In this field, you can set how many URLs the tool will scan per second. The maximum number of Screaming Frog's default settings is 5, and the number of URLs crawled per second is 2. You may need to reduce the browsing speed according to the server performance of the site you are browsing, otherwise, if the number of requests per second is high, you are likely to encounter 500 errors.User-Agent: Before you start scanning, you can regulate which User-Agent you will use to visit the pages with this setting. It may have blocked the Screaming Frog User-Agent on the server side of a website to be scanned. In this case, if you use the Screaming Frog User-Agent, your scan will not occur. You can use this field to check the crawlability of your website in different user-agent options.HTTP Header: The HTTP Header option allows you to scan by providing custom HTTP Header request during a scan in Screaming Frog.Custom Search: The Custom Search section is a feature that allows you to search for any data you want in the source code of a site, thanks to Screaming Frog. You can search HTML for a value you enter as Text or Regex in the Custom Search section. You can check whether the value you entered is in HTML with the "Contains" or "Does Not Contains" options, and you can get the results.Custom Extraction: The Custom Extraction section allows you to extract data from a site's HTML using CSSPath, XPath or Regex. For example, you can access the product codes on the product pages of an e-commerce site with the CSSPath, XPath or Regex settings you will make through this field. The Custom Extraction tool allows you to extract data from working HTML pages that only have 200 response codes. You can switch to JavaScript rendering mode to pull data from HTML rendered outside of a static HTML page.Custom Link Positions: Screaming Frog scans a web page's content, sidebar or footer areas and categorizes each link it discovers based on its location. With the Custom Link Positions tool, you can ensure that the XPath field, which expresses the link positions in the "Inlinks" and "Outlinks" sections in Screaming Frog, works in accordance with the criteria you specify. Thus, you can check whether there is a link in the field you specified.Google Analytics API: By connecting your Google Analytics account with Screaming Frog, you can perform a more detailed scan with your old URLs. To make this connection, you need to click the Google Analytics tab from the API Access menu and then click the “Connect to New Account” button to connect with your Analytics account.Search Console API: For the Search Console connection, you need to click on Google Search Console from the API Access menu and click the "Connect to New Account" button in the window that opens and select your Google account where your Search Console property is located and give the requested permissions. In this way, you can also perform a check for your URLs that were previously discovered and crawled by Google but are not currently on our website.Page Speed Insight API: If you want to see the speed values of your crawled URLs obtained from PageSpeed Insights together with the Screaming Frog scan, you must click on the PageSpeed Insights section of the API Access menu and enter the desired "Secret Key" information before starting your scan. In this way, you will be able to see the speed performance metrics of your crawled URLs in your crawl results.Ahrefs API Connection: If you want to see data from Ahrefs in your scan results, you can connect your Ahrefs account with Screaming Frog. When you click the Ahrefs section in the API Access menu, you need to enter the "Access Token" information in the window that opens.Authentication: If the website you want to scan works after a user log in, you can save your site's user login URL and username & password information to Screaming Frog from the "Forms Based" section in this area. In this way, while scanning, the Screaming Frog bot will first log into your site as if it is a user and will be able to scan for the pages that come after the login screen.

What is Robots.txt and How to Create and Use It?
When search engine bots visit a website, they use the robots.txt file to control crawling and indexing. Also known as the Robots Exclusion Standard, robots.txt tells crawlers which files, folders, or URLs on your web server they may or may not access.You may have heard many misconceptions about how to use robots.txt. In reality, it simply tells visiting bots which URLs on your site they should crawl. It’s used primarily to reduce request load and optimize crawl budget. It is not a way to prevent pages from appearing in search results—that requires a tag or authentication barrier.What Is Robots.txt?robots.txt is a plain-text file placed in your site’s root directory that gives crawlers directives about which URLs (HTTP 200) they may or may not crawl.Bots generally obey these directives. Pages disallowed in robots.txt won’t be crawled, though if those URLs are linked elsewhere, Google may still crawl them.SEO Tip: If bots encounter a 5xx server error reading your robots.txt, they’ll assume something is wrong and stop crawling. That can make images behind a CDN disappear from Google’s view, for example.Why Is Robots.txt Important for SEO?Before crawling your sitemap URLs, bots first fetch your robots.txt. Any incorrect directive can lead to important pages being skipped. A temporary misconfiguration shouldn’t be irreversible—but fix it quickly to avoid lasting harm.For instance, if you accidentally disallow a key category page, it won’t be crawled until you remove the directive. Bots cache your robots.txt for 24 hours, so changes take up to a day to take effect.Where to Find Robots.txtPlace your robots.txt in your site’s root directory (e.g. example.com/robots.txt). Crawlers universally look for it there—never move it.Creating Robots.txtYou can hand-edit robots.txt with any text editor or generate it via an online tool. Then upload it to your site’s root.Manual CreationOpen a plain‐text editor and enter directives such as:User-agent: * Allow: / Sitemap: https://example.com/sitemap.xml Save as robots.txt and upload to your root directory.Recommended DirectivesKey robots.txt commands: User-agent: Selects which crawler a rule applies to. Allow: Grants crawling permission. Disallow: Blocks crawling of specified paths. Sitemap: Points crawlers to your sitemap URL. User-agentSpecifies which bot follows the following rules. Common bots include: Googlebot Bingbot YandexBot DuckDuckBot Baiduspider …and many more. Example: Block only Googlebot from a thank-you page:User-agent: Googlebot Disallow: /thank-you Allow & DisallowAllow: permits crawling. Without any directives, the default is “allow all.”Disallow: forbids crawling of the specified path.Examples: Allow all: User-agent: *Allow: / Block all: User-agent: *Disallow: / Block a folder but allow one subpage: User-agent: * Disallow: /private/ Allow: /private/public-info Testing with Google’s Robots.txt TesterIn Google Search Console, under Index > Coverage, you’ll see any robots.txt-related errors. You can also use the Robots.txt Tester to simulate how Googlebot handles specific URLs.Common GSC Warnings Blocked by robots.txt: URL is disallowed. Indexed though blocked by robots.txt: Page is in the index despite being disallowed—use noindex or remove links. Best Practices & Reminders Bots fetch robots.txt before crawling any page. Use Disallow: to prevent low-value pages from being crawled and wasting budget. Include your sitemap with Sitemap:. Keep robots.txt under 500 KiB—Google only reads up to that size. Test for server errors—5xx responses cause bots to stop crawling. Respect case sensitivity in URL paths. Conclusionrobots.txt is a simple yet critical file for guiding crawlers and optimizing your crawl budget. Ensure it’s correct, keep it at your root, and test any changes promptly.
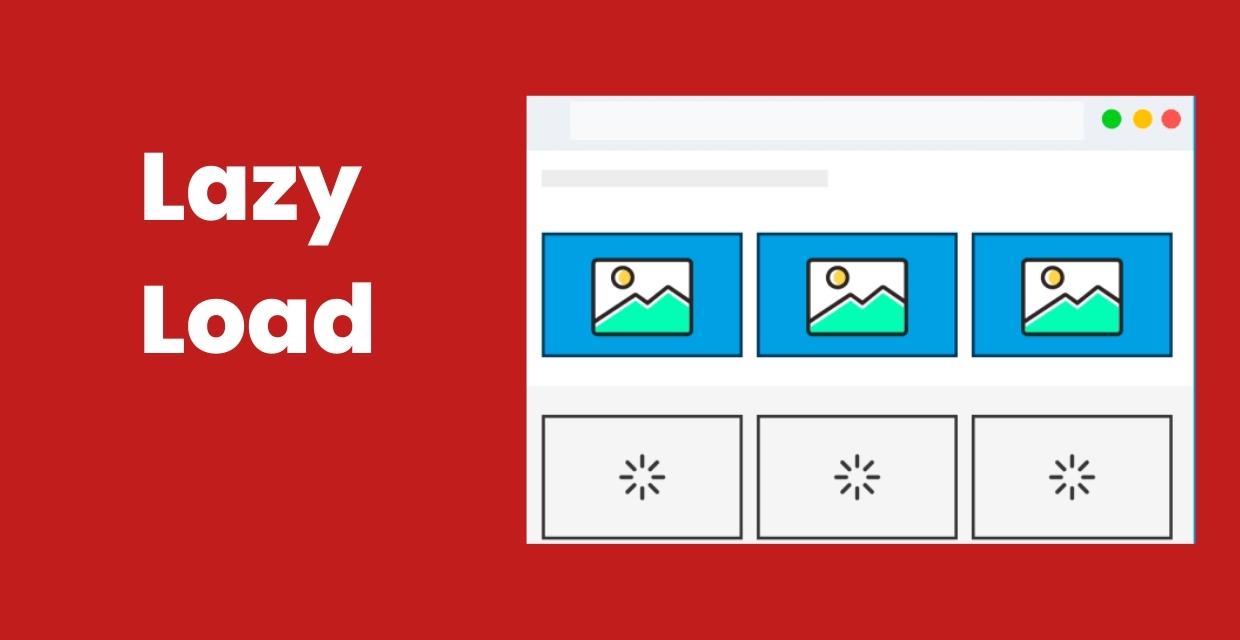
Lazy Load: Improve Website Loading Performance
In order to increase the loading speed of the website, we will discuss the lazy-loading issue, which is recommended by Google and must be used. In order to increase site performance, the lazy load feature, which reduces the initial page load and load time, should be used, thanks to the method to be applied to the images and/or videos on the page.You will find answers to questions such as "What is lazy load?", "What are the advantages and disadvantages?", and "Why lazy load should be preferred and how can it be applied?" in this content.What Is Lazy Load?Lazy load is a technical method that allows the post-loading of non-critical images and videos while the web page is loading. Non-critical resources are loaded when they are needed or in their turn. Lazy loading is optional and has no negative effects on the web page when used correctly.If you have used the PageSpeed Insights tool, it gives you some suggestions to improve the performance of your web page on mobile and desktop devices. PageSpeed Insights offers you some opportunity suggestions to improve the performance of the page you are analyzing. Among these recommendations are warnings that sometimes "non-critical" or "off-screen images" should be postponed.At this point, PageSpeed Insights states that the lazy load technique should be used for the images on the website. If you have encountered the following events when visiting any website, you most likely have visited a lazy load page. Here are some symptoms of lazy load usage: Content comes as you scroll on the page you visit, As you scroll the screen, the image becomes clear and the real image is loaded, The image with optional lazy loading suddenly pops up in its turn. All websites, especially e-commerce websites, use the late loading technique of images.On the Medium website, the placeholder technique is used, in which a smaller image is added instead of the original image, and when the screen starts to scroll, the original image takes its place.SEO Tip: Lazy-loading should be applied to invisible images outside the screen, not the first images that appear when the screen is opened.Why is Lazy Load Used in Web Pages?Lazy load is used to prevent the site from loading late and to improve performance while the images or videos on the web pages are loading the page. The purposes of using lazy load are as such:When the lazy load is not used, it causes unnecessary data consumption while loading a web page and downloading images that the user may never see. Server requests will be reduced. For every resource on the web page, the server is requested to no avail while the page is loading. In this case, it affects the site performance negatively. If lazy-loading is not used on the web page, it wastes hardware resources for the browser to understand and decode the code content and place the image in the content. In order to improve the performance of the website, the lazy loading of images and videos, reducing the number of requests, resource consumption and data size reductions are among the factors that will positively affect the performance.Advantages of Using Lazy Load When you want to optimize your visual content on your website online, using lazy loading reduces memory usage and provides a good user experience. Unnecessary code execution on the web page is avoided. The reason is that the content will be loaded in its turn. For website owners, it can reduce the resource cost as the request to the server is reduced. Disadvantages of Using Lazy Load The lines of code to be added to lazy-load images after the website is set up can confuse you when interpreting the code. Misuse can prevent your content from appearing in search engines. How to Apply Lazy Load to Pictures and Videos?There are different methods for applying the lazy-loading feature to the images on the web page. Modern web browsers lazy-load images and videos on web pages at the browser level. In older browsers, there are auxiliary javascript libraries to use the lazy load technique.What is Browser-Level Lazy Loading?Browser-level lazy loading for web pages is when modern browsers have coded lazy loading built into the background. Modern browsers are actively used in browsers such as Chrome, Firefox, Edge, and Opera with chromium support.For example, in modern browsers, to make images below the viewport load at a lower priority, simply add the loading attribute to the img and iframe elements.With the loading feature above, you do not need to add an extra library in the source code of your website for modern browsers.Using Lazy Load for PicturesIn HTML, two methods are used to include images on a web page. Images are loaded on web pages with CSS as a background image or element. Let's examine how the lazy load feature is implemented for both image loading methods.Using Lazy Load for Image ElementWhile adding the lazy load feature to the inline element in HTML, you can take advantage of the JavaScript libraries for modern browser-level lazy load or lazy load. We have included our example for browser-level installation in the previous topic. For older browsers, you can use JavaScript libraries.Using Lazy Load for Background ImageIn some websites, some images are used as background images with the help of CSS. Although this situation is not recommended in terms of SEO, it is a situation that should be considered in indirect SEO studies.The best solution for this situation is to load an image much smaller in size instead of the background image until it's time. It will be replaced by the original picture when it is their turn.Using Lazy Load for VideosAs in visual media, it can be ensured that videos are loaded late on web pages containing videos. The best usage method for this method is to activate the videos by the users.Google's Perspective on Lazy LoadGoogle says that the use of lazy-loading is among the best practices in terms of increasing performance and user experience when it comes to late loading of off-screen images on the web page. However, Google also says that this technique will cause the content to be hidden in Google if used incorrectly. In order for Googlebot to see all the content on the web page, make sure that the content is displayed while it is being viewed.Lazy Load Plugin Recommendation for WordPress WebsitesFor WordPress website owners, we recommend using the native lazy load plugin released by Google. After adding the plugin to your website, you do not need to take any additional action. The loading="lazy" attribute will be automatically added to all images and iframes on your website.Thanks to this simple and useful plugin, Googlebot will have no problem indexing lazy-loaded images on your website without any problems.How to Install Lazy Load?Lazy load installation varies according to the infrastructure of your website. If you have a WordPress website, you can follow the steps below on how to set up Lazy Load to snooze off-screen pictures. Login to the WordPress admin panel Click on Plugins > Add New button Type "Native Lazyload" in the "Search for plugins..." field Click the "Install Now" button to install the add-on Click the "Activate" button after the installation is complete That's how easy the installation is! This plugin that you install to optimize the WordPress website will take care of everything automatically for you.If there is no CMS website, add the JS file URL of the lazyload library you want to use between the tags of your site to install lazyload. Then just write "lazyload" to your image's class.ConclusionWhen the lazy load feature is used carefully and correctly, lazy-loaded images and videos can reduce the file size downloaded during the initial web page load time and on-page load.Users who visit the website can sometimes leave the site without scrolling to sub-pages in the content. Lazy loading leads to both network demand and resource usage, as images below the screen are downloaded on unused sites.If the web page contains too many images, lazy loading is a very good technique to improve the performance of your website on the PageSpeed Insights side.
How to Fix Remove Unused CSS Warning
Updates in search engine algorithms have made many metrics and technical infrastructure important to provide a more successful user experience. In the period from 2015 to 2022, users' mobile and tablet usage increased significantly, while desktop and laptop usage decreased. This situation has caused poor user experiences, especially on sites with large page sources.For example, users visiting a website from mobile devices experience excessive resource consumption and wasted time while loading websites with high-volume images and unused CSS and JS files. This is because the loading times and site speeds of such websites provide an inadequate experience for users, and since the user accesses the site from a search engine, it also causes search engines to lose image.Aware of this, search engines have started to pay significant attention to website speed and resource consumption with the latest updates in their algorithms. To optimize this situation, website owners have strengthened their optimizations in this regard by analyzing the speed and resource consumption of their websites with measurement tools such as Pagespeed and GTMetrix.Pagespeed Page Speed AnalysisAmong the most important performance tools used when optimizing a website, Pagespeed and GTMetrix tools undoubtedly come first. Pagespeed, in particular, developed by Google, shares with us the speed metrics that prevent a successful user experience on websites.One of the metrics that website owners frequently encounter and often fail to solve in Pagespeed analyses is the removal of unused CSS files.Unfortunately, Pagespeed and GTMetrix tools do not share with us which lines in the unused CSS files are actively used, but only provide us with estimated savings and files. This warning alone is not enough to solve this problem.What Are Unused CSS Files?In today's modern web programming technologies, many developers prefer ready-made libraries instead of coding HTML & CSS from scratch. Libraries like Boostrap and Tailwind are examples of these structures. The difference of ready-made CSS libraries is that they collect many button, navbar, grid structure, visual and design commands under certain classes in a single library. In this way, web site developers can easily use all style and CSS arrangements by giving a class to the relevant HTML element, instead of writing separate CSS commands for each structure and module. For example, while many lines of CSS code need to be written to give a button various color and radius styles and hover effects, the desired style arrangements can be obtained by giving a single class since the relevant commands and lines are included in the ready-made library.Although ready-made CSS libraries are very practical for developers, they can cause some problems in SEO-related arrangements as they increase the query and resource consumption on the website. For example, when you include the bootstrap library on your website, you can actively use only 1 or 2 of the 16 different button styles in it. The remaining 14 button styles continue to be included in the CSS file and increase the page's resource consumption even though they are not actively used.In these cases, performance tools that measure speed, such as PageSpeed, inform us that there are actively unused CSS files on the website and ask us to make optimizations related to this.How to Detect Unused CSS Files?There are several ways to detect unused CSS lines on a website. You can use modules like purgeCSS or manually view these lines from the page inspection.To detect unused CSS files, the first thing you need to do is right-click on the page and click on the "Inspect" option.Then click on the three dots on the right side of the window that opens and click on the More Tools > Coverage option.You will see a record button in the section that opens at the bottom. Click this button and refresh the page with CTRL + F5 or Command + F5. After the page is refreshed, you will see that many CSS and JS files have appeared below.The rates on the right side in this section show the unused rate in the relevant CSS file at the moment the page is loaded.When you click on any CSS file, the relevant file opens in the window, and you can again view the unused CSS lines in red and the actively used ones in blue.The important detail here is to determine which code is used on different pages and which lines are active on mobile and tablet devices.How to Remove Unused CSS Files?We learned where to see the unused CSS lines on the website. However, the important part here is to be able to analyze well which CSS line is really used and which is not. Because some CSS lines may be included in a single file for different pages, as well as being included in mobile and tablet devices.For this reason, you should first copy the unused lines from the ready-made library codes in the CSS lines, then navigate to the service, category, product, contact, etc. pages of the site and perform the coverage process we shared above on each page.In addition to this process, you should switch to the mobile and tablet views of your website from the device selection area in the inspect section and, in the same way, visit all pages and copy the unused CSS lines to one side.In the final stage, you can clean the common and actively unused CSS lines among all the CSS lines you have copied.Note: It is recommended that you perform all these operations on the test version of your website and, after performing the cleaning, carry it to the main version if no problems are observed.

What is Google Search Console? How to Use Google Search Console?
Google Search Console can be defined as a free Google Webmaster tool, available to anyone who owns a website. Of course, that definition is very general. More precisely, Google Search Console is a tool that allows site owners to check and optimize their website’s presence on Google.In this article, we will answer many common questions about Google Search Console.What is Google Search Console?Let’s take a closer look at what Google Search Console really is, beyond the general outline above.Google Search Console is a free Google service useful to anyone with any relationship to Google on the web. Formerly called Google Webmaster Tools, it evolved into today’s Search Console as each tool was specialized. Another useful free tool provided by Google is Google Analytics. Search Console and Google Analytics used to be integrated directly.With Google Search Console, you can see how Google views your site. You can also access detailed performance data—such as which queries drive how much organic traffic—which pages rank for which keywords.Search Console isn’t just for site owners; content creators benefit too. Ranking issues can arise from technical errors, preventing valuable content from appearing correctly in search results. Search Console helps diagnose and fix such issues for individual pages or entire sites.To use Google Search Console, you need a Google account. Simply go to https://search.google.com/search-console/ and sign in with your Google credentials.On your first visit, you’ll see a screen like the one above, where you can add the sites you own to your Search Console account.Adding a Site to Search ConsoleAfter setting up your account, you must add your site to Search Console to verify ownership. The steps are as follows:You have two options here. “Domain” verifies all subdomains and protocols under that domain in one property. “URL prefix” verifies only the exact URL you specify. Because some sites require separate entries for https:// and http:// under “Domain,” you may prefer “URL prefix” to avoid duplicate properties.Site Verification MethodsSearch Console offers several methods to verify you own the site. All methods confirm that the person requesting Search Console access has control over the site’s code or files. In every case, you must either upload a file or add code that only the site administrator can do.HTML File UploadAfter entering your site URL and choosing verification, you can download a unique HTML file from Google. Upload that file into your site’s root directory (usually public_html), then click “Verify.”Once Google can fetch that file, you’ll see a “Ownership verified” message. If you later remove the file, verification will expire and you’ll lose Search Console access.HTML Meta TagYou can also verify by adding a meta tag to the section of your site’s homepage.Paste Google’s unique verification code into your , click “Verify,” and you’ll gain access immediately.Other methods include: Google Analytics: Verify if you already have Analytics tracking set up. Google Tag Manager: Use your GTM container snippet to verify. Domain name provider: Add a DNS TXT record at your domain registrar. Adding the Correct PropertyA common pitfall is adding duplicate properties—for example, both https://analyticahouse.com and https://www.analyticahouse.com. Technically they are different URLs. The canonical version should be used, or add the domain property to cover all variants in one go.Search Console TerminologyWhat is a Search Query?Every keyword search that returns your site in results is counted as a query. Search Console shows which queries your site appears for, along with performance metrics.ImpressionsAn impression is counted each time a URL from your site appears in a user’s search results. The user doesn’t even need to scroll down; merely being listed counts as one impression.ClicksA click is when a user clicks through from the search results to your page. Repeat clicks in the same session don’t count; clicks from different sessions or after clicking another result will count again.Average PositionThis is the average ranking position of your pages for a given query or set of queries. For example, if one page ranks 7th for “Google Algorithm” and 5th for “Algorithm Updates,” its average position would be 6.CTR (Click-Through Rate)CTR is clicks divided by impressions, expressed as a percentage. If you get 50 clicks from 100 impressions, your CTR is 50%.Key Filters in Search ConsoleSearch TypeFilter performance by search type: Web, Image, Video, or News. You can also compare two search types side by side.Date RangeFilter data by date range—last 7 days, last 28 days, last 3 months, etc.—or compare two ranges for trend analysis.Query, Page, Country, DeviceUnder “New” you can filter by specific queries, pages, countries, or devices (desktop, mobile, tablet).Index Coverage ReportThis report shows which pages Google successfully indexed, which have errors, and which were excluded (e.g., due to canonical tags).Submitted SitemapsSee which sitemaps you submitted and whether Google could read them successfully.Common Uses of Search Console DataHere are the most frequent ways to leverage Search Console for SEO: Identify pages with the most organic clicks Find queries with the highest CTR Track CTR trends over time Monitor impressions over time Discover pages with the highest rankings Spot pages with declining rankings Detect ranking improvements or drops Find queries driving the most traffic Compare performance across desktop, mobile, and tablet Check how many pages are indexed vs. have indexing issues Detect mobile usability issues See total backlinks Identify which URLs have the most backlinks Inspect how Googlebot fetches a specific URL Top Organic Pages by ClicksGo to Performance → Pages, set your date range (e.g., last 12 months), check only the Clicks metric, and sort descending.Queries with Highest CTRIn Performance → Queries, set your date range, check only CTR, and sort descending.Track CTR Over TimeIn Performance, view the CTR line chart to catch sudden drops or spikes, which may indicate changes in rankings or impression volume.Track Impressions Over TimeSimilarly, the Impression chart reveals whether you’re gaining visibility for more keywords or losing ground.Pages with Highest Average PositionIn Performance → Pages, set date range to last 28 days, check only Average Position, and sort ascending.Pages with Lowest Average PositionSame steps as above, but sort Average Position descending to find underperforming pages.Detect Ranking ChangesUse the date comparison in Performance → Queries to spot keywords that rose or fell between two periods.Top Traffic-Driving QueriesIn Performance → Queries, set date range, check Clicks, and sort descending.Device ComparisonIn Performance → Devices, check all metrics to compare desktop, mobile, and tablet performance side by side.Indexed vs. ErrorsIn Coverage, see how many pages are valid (indexed) versus errors (not indexed).Mobile Usability IssuesIn Mobile Usability, view any pages with mobile errors.Total BacklinksUnder Links → External, click “More” and view the total number of backlinks.Top Linked PagesIn the same report, sort “Top linked pages” by descending links.URL InspectionUse the URL inspection box at the top to see how Googlebot fetches a specific URL and whether it’s indexed.ConclusionGoogle Search Console is an essential SEO tool, playing an active role in diagnosing and improving a site’s interaction with Google search. We’ve covered its most common uses, but Search Console offers much more. As Google continues to enhance this tool, familiarity with Search Console is becoming mandatory for anyone working in digital marketing or web development.

Log File Analysis for SEO Performance
From an SEO performance perspective, log file analysis—and specifically examining the server’s access logs—tells us exactly how search engine bots behave after they crawl our site.In this article, we’ll answer “How do you perform a detailed log file analysis for SEO?” and “What are the benefits of log analysis?” using various scenario-based examples.What Is a Log File?Log files record who accessed your site, when, from which IP, and which URLs they requested.“Visitors” includes not only human users but also Googlebot and other search engine crawlers.Your web server writes these logs continuously and rotates or overwrites them after a set period.What Data Does a Log File Contain?A typical access log entry looks like this:27.300.14.1 – – [14/Sep/2017:17:10:07 -0400] “GET https://allthedogs.com/dog1/ HTTP/1.1” 200 “https://allthedogs.com” “Mozilla/5.0 (compatible; Googlebot/2.1; +http://www.google.com/bot.html)”Depending on your server configuration, you might also log response size or request latency. A breakdown of the key fields: IP address of the requester Timestamp of the request Method (GET or POST) Requested URL HTTP status code (see HTTP status codes) User-Agent string, telling you the client or crawler type Googlebot IP Address ListIn November 2021, Google published the full list of IP ranges it uses to crawl websites. You can find the JSON here:https://developers.google.com/search/apis/ipranges/googlebot.jsonWhere to Find Your Log FilesLogs live on your web server or—in some cases—on your CDN. How you access them depends on your server stack (nginx, Apache, IIS) and control panel. For example:cPanel: /usr/local/apache/logs/ or via the “Raw Access Logs” featurePlesk: /var/www/vhosts/system/your-domain.com/logs/Why Is Log Analysis Important for SEO?Analyzing logs tells you exactly which URLs search bots actually fetch—and whether they encounter errors.Unlike tools like Screaming Frog or DeepCrawl, which follow links, bots revisit URLs they’ve previously seen. If a page existed two days ago but now 404s, only logs reveal that mismatch.Log analysis can show you: Which pages bots crawl most often (and which they ignore) Whether bots encounter 4xx or 5xx errors Which orphaned (unlinked) pages are still being crawled Tools for Log File AnalysisPopular log analysis tools include: Splunk Logz.io Screaming Frog Log File Analyser (free up to 1,000 lines) Semrush Log File Analyzer GSC Crawl Stats vs. LogsGoogle Search Console’s Crawl Stats report shows some high-level crawl data, but it’s nowhere near as granular as raw logs.To access it: Settings > Crawling > Open report.Interpreting Crawl Stats Status All good: No crawl errors in the last 90 days Warning: An error occurred more than 7 days ago Critical: Errors detected within the last 7 days The report also breaks down by status code, file type, and crawler type (desktop, smartphone, AdsBot, ImageBot, etc.).How to Interpret Your Log AnalysisWith logs, you can answer: What percentage of my site do bots actually crawl? Which sections never get crawled? How deep into my site do bots venture? How often do they revisit updated pages? How quickly are new pages discovered? Did a site structure change affect crawl patterns? Are resources (CSS, JS) delivered quickly? 7 Example ScenariosHere are seven practical ways log analysis can inform your SEO strategy:1. Understand Crawl BehaviorCheck which status codes bots see most often and which file types they request. For example, in Screaming Frog’s log report: 2xx codes on HTML/CSS/JS are ideal—pages load successfully. 4xx codes indicate broken links or removed pages—these can waste crawl budget. 3xx codes show redirects—make sure only necessary redirects remain. 2. Identify Your Most Important PagesBots allocate more crawl budget to pages with more internal or external links. If you see excessive crawl on an English subdirectory, for instance, you might adjust your navigation or internal linking.3. Optimize Crawl BudgetEven smaller sites benefit from eliminating waste. Use logs to find URLs with unnecessary parameter crawls, frequent 301s, or robots.txt misconfigurations. Remove parameterized URLs from your sitemap and internal links. Set long Cache-Control headers for static assets. Consolidate multiple redirects into a single chain. Fix robots.txt typos so bots respect your crawl rules. 4. Detect Crawl ErrorsHigh volumes of 4xx/5xx responses can cause bots to throttle or stop crawling. Compare 2xx vs. error rates and fix broken pages promptly.5. Find Crawlable but Unindexed PagesPages eligible for indexing but rarely crawled can be found by filtering logs on low crawl frequency—e.g. “XX weeks ago.”Add these pages to your sitemap, link to them internally, and refresh their content.6. Discover Orphan PagesOrphan pages (unlinked) may still appear in logs. Filter logs for 200-OK HTML URLs with zero internal referrers. Then add internal links or remove them if they aren’t needed.7. Aid Site MigrationsDuring a migration, logs show your most-crawled URLs so you can prioritize preserving their redirect paths. After migration, logs reveal which URLs bots can no longer find.Using Log Analysis to Drive SEO FixesBy acting on your log insights, you can: Remove non-200 URLs from your sitemap Noindex or disallow low-value pages Ensure canonical tags highlight key pages Boost crawl frequency by adding internal links to strategic pages Guarantee all internal links point to indexable URLs Free up crawl budget for new and updated content Verify category pages are crawled regularly ConclusionLog file analysis is a powerful way to discover hidden SEO issues and refine your crawling strategy. If you found this guide helpful, please share it on social media so others can benefit!