

Marketing tips, news and more
Explore expert-backed articles on SEO, data, AI, and performance marketing. From strategic trends to hands-on tips, our blog delivers everything you need to grow smarter.
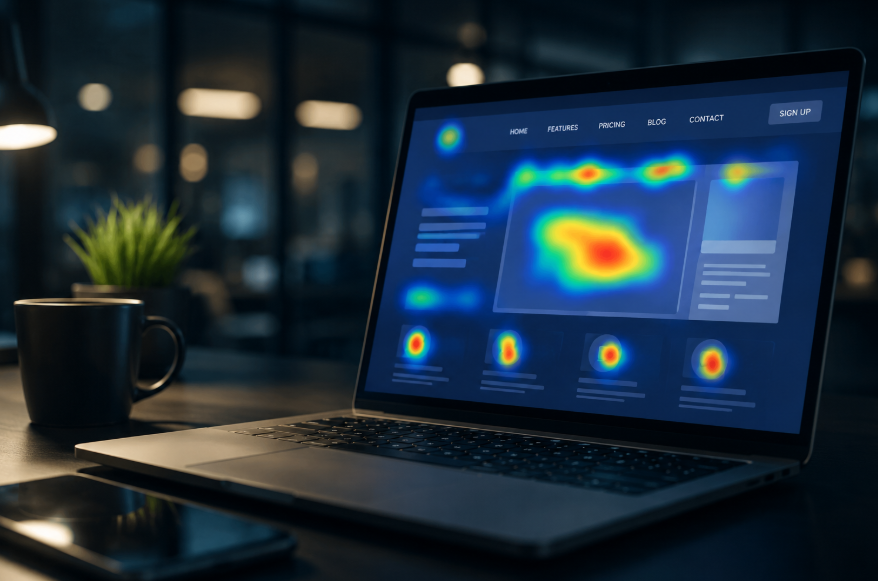
Do Heatmap Tools Really Work? The Power of Data in User Behavior Analysis
In the world of digital marketing and website management, the "data-driven decision-making" process is no longer a luxury—it is a fundamental necessity. However, the quantitative metrics you obtain through traditional analytics tools often fall short of explaining why users behave in a certain way on your website. This is exactly where heatmap tools enter the equation. So, are these visualization tools really as effective as claimed, or are they merely visual illusions consisting of colorful charts?Let’s explore the role of heatmaps in user behavior analysis workflows, their unbreakable bond with UX analysis, and their strategic importance within CRO tools. We will take a close look at the technical details of how insights provided by industry-leading platforms like Hotjar and Microsoft Clarity can transform a website's performance.What is a Heatmap and How Does It Work?A heatmap is a data analysis method that visualizes user interactions on a web page using a color spectrum—typically moving from cold blues to hot reds. These tools track your users' clicks, mouse movements, and page scroll depth through JavaScript code snippets. The resulting raw data allows you to cleanly discern which regions of your page are "hot" (receiving high engagement) and which areas are "cold" (ignored).You can evaluate heatmaps across three core categories within user experience optimization frameworks:Click Maps: Displays exactly where your users click on the page.Move Maps: Tracks where users move and hover their mouse cursors; this data typically shares an 80-90% parallel with eye-tracking studies.Scroll Maps: Analyzes how far down the page your users scroll.Scroll Depth Analysis: Is Your Content Actually Being Read?One of the greatest misconceptions you can fall into as a website owner is assuming that if you produce high-quality content all the way to the bottom of the page, users will naturally reach it. Scroll depth analysis enables you to test this assumption with real-world data. It is crucial to remember that most users spend the vast majority of their time "above the fold"—the initial part of the page that loads immediately without scrolling.What exactly does scroll depth data tell you?Strategic Positioning of Critical Info: If your primary "Call to Action" (CTA) button is located at the 70% mark of your page, but only 10% of your users scroll down that far, you are suffering a massive loss in conversions.Content Stream Friction: If you spot a definitive drop-off point where users abandon the page in bulk, it usually indicates a dry or unengaging visual or text block pushing them away.Mobile vs. Desktop Variance: While mobile users are generally more accustomed to scrolling, their attention spans are shorter. Scroll maps clarify these behavioral variances between device segments.Rage Click Examples: Why Are Your Users Getting Frustrated?One of the most striking outputs of combined heatmap and session recording features is the detection of rage clicks. A rage click occurs when a user repeatedly and rapidly clicks on a specific spot on your website within a short time frame. This behavior is a clear distress signal indicating user frustration or a technical glitch.Real-world examples of rage clicks you may encounter include:Non-Clickable Visual Assets: A user expects an image to enlarge or redirect them to a product detail page when clicked. If the asset is static, they tap repeatedly in frustration, wondering why it won't open.Unresponsive or Slow-Loading Buttons: When a user hits a "Buy Now" button and the page fails to respond instantly, they assume the system missed the command and mash the button. This frequently results in duplicate transactions or backend error messages.Misleading Design Elements: When users mistake underlined or uniquely colored text blocks for a hyperlink, they execute angry clicks when the element fails to navigate anywhere.Analyzing these behavioral friction points must sit right at the top of your data analysis action lists. Minimizing rage click rates directly correlates with elevated customer satisfaction and trust in your brand.The Critical Synergy Between UX and Conversion Rate Optimization (CRO)Just because your website looks aesthetically beautiful does not mean it is functionally successful. While UX analysis measures the structural usability of a design, CRO tools evaluate whether that usability effectively translates into a commercial outcome (such as a sale or a completed form). Heatmap tools serve as the ultimate bridge between these two disciplines.Analysis TypeUX ContributionCRO ContributionClick MapsMeasures navigation ease and spatial intuitiveness.Tests the explicit effectiveness of primary CTA buttons.Scroll MapsDetermines baseline readability and content hierarchy.Reveals whether key offers are positioned in optimal viewports.Session RecordingsDetects technical bottlenecks, bugs, and user obstacles.Uncovers the specific friction points causing checkout cart abandonment.As highlighted across performance marketing best practices, launching a CRO campaign without proper user experience optimization is like building a house without a foundation. Heatmap data pinpoints exactly where a problem exists, and you resolve it through UX modifications to drive up conversion metrics.Hotjar vs. Microsoft Clarity: Which Tool Should You Choose?While the market offers various user behavior analysis toolkits, Hotjar and Microsoft Clarity stand out as the most prominent alternatives. Both solutions offer distinct, specialized advantages.HotjarHotjar is a pioneer in the user behavior analysis landscape. Beyond traditional heatmaps, it allows you to capture qualitative data directly from your users through integrated surveys and feedback widgets. Hotjar's strongest suit is its highly user-friendly reporting interface, which simplifies the process of making sense of complex data pools.Microsoft ClarityDeveloped by Microsoft, Clarity sets itself apart by being completely free with support for unlimited traffic volumes. Its native integration with Google Analytics is an exceptional benefit, enabling teams to merge quantitative and visual data onto a single interface. Specialized metrics within Clarity, such as "Dead Clicks" and "Quick Backs", deliver unparalleled user insights.A Real-World E-Commerce Case ScenarioImagine managing an e-commerce storefront and noticing that a prominent "Special Offers" hero banner on your homepage is receiving far fewer clicks than anticipated. Google Analytics can only tell you that the click-through rate (CTR) is low. However, by deploying session recording and heatmap tools, you uncover the following reality:Your users are scrolling down far enough to see the banner (Scroll depth is sufficient).The mouse cursor hovers over the asset frequently (Interest is verified).Users are actively clicking on the product images inside the banner, but the images themselves are not hyperlinked—only a tiny "View Product" button contains the active link (Resulting in rage clicks and missed interactions).Following this analysis, a simple UX adjustment—making the entire banner asset clickable—will directly maximize your conversion rates and net sales. This is the exact moment when heatmap tools prove they genuinely work.Conclusion: Heatmaps are the Compass of Data AnalysisIn summary, heatmap tools are not standalone magic wands. However, when decoded properly and paired with deep data from your primary analytics tools, they serve as the strongest compass for your digital strategy. They remain indispensable for uncovering on-site friction, viewing your platform through your users' eyes, and systematically erasing friction points.At AnalyticaHouse, we proactively integrate heatmaps and user recordings into our data-driven growth strategies. To unlock your website's absolute peak potential and build a deep understanding of your audience, making UX analysis and CRO toolsets a standard operation is vital. Assumptions can misguide you; actual user behaviors will always point you in the right direction.

Most Common Measurement Errors in GA4: How to Protect Your Data Accuracy
Since its introduction to the digital marketing landscape, Google Analytics 4 (GA4) has fundamentally changed our data collection and processing habits. However, the migration process from Universal Analytics (UA) and GA4's event-based architecture brought along numerous technical challenges. A misconfigured GA4 account does not just present you with flawed reports; it also leads to incorrect ad optimizations and wasted budgets. In this guide, we will analyze the most common analytics mistakes, data loss scenarios, and exactly how you can solve these tracking issues.At AnalyticaHouse, we have compiled our extensive experience handling GA4 errors and Google Analytics problems across hundreds of client accounts to help you improve your business's data health.1. Duplicate Event Tracking ProblemsOne of the most frequent errors encountered in GA4 architectures is duplicate event tracking. This occurs when a single action performed by a user (such as a button click or a form submission) registers in the analytics system two or more times.Factors Leading to This Issue and Potential Outcomes:GTM and On-Page Code Conflicts: Deploying tags simultaneously via Google Tag Manager (GTM) and directly inside the website's source code (gtag.js) leads to double-counting.Enhanced Measurement Clashes: Automatically capturing events like "Scroll", "Outbound Clicks", or "Form Interactions" within the GA4 panel while manually setting up identical triggers in GTM corrupts your data streams.Page Refreshes: In conversion configurations tracking simple thank-you page URLs, the event can re-trigger every single time a user refreshes the browser page.This flaw inflates your conversion tracking metrics and misleads your primary ad channels (Google Ads, Meta Ads, etc.) into optimizing based on artificial spikes. Consequently, your Cost Per Acquisition (CPA) metrics appear lower than they actually are, clouding your financial visibility.2. Cross-Domain Tracking OmissionsIf your digital operations redirect users from your primary website domain to a distinct external checkout portal or a third-party application, configuring cross-domain tracking is absolutely vital. Omitting this technical setup disrupts the continuous customer journey.Data Loss Scenario: Referral Exclusion IssuesFailing to implement cross-domain tracking causes your primary domain or native payment gateways (such as PayPal or stripe variants) to display in your source reports as "Referral" traffic. This triggers severe marketing attribution errors. The true origin of a conversion gets assigned to "your-own-site.com" or the payment processor rather than recognizing the initial "Google Ads" or "Organic Search" interaction. This ranks as one of the most destructive analytics errors, rendering your e-commerce tracking workflows completely non-functional.3. Faulty Attribution and Custom Channel Grouping ImpactsWhen allocating your digital marketing spend, you need absolute clarity regarding which specific channel yields a corresponding return. However, inaccurate event measurement actively skews data-driven attribution models.While GA4 utilizes a "Data-Driven Attribution" model as its default setting, the following configuration oversights heavily undermine its baseline machine learning accuracy:Inconsistent UTM Tracking: Deploying broken, mistyped, or non-standard UTM parameters across your ad URLs forces high-intent traffic directly into the "Unassigned" reporting bucket.Improper Session Timeout Windows: Setting session timeouts too short can kill an active session prematurely during intermittent user pauses, incorrectly assigning subsequent conversions to a fresh session source.Redirect Parameter Drops: Faulty server-side redirects that scrub URL queries clean during page changes erase the true traffic source, replacing it with a generic direct label.4. Technical Missteps in E-Commerce Tracking DeploymentsE-commerce tracking serves as the literal pulse of a digital retail platform. Because GA4 operates on an entirely unique data schema compared to legacy Universal Analytics, the migration phase must be executed with extreme technical care.E-Commerce Tracking Error & Solution Matrix:Error TypeStrategic ImpactResolution StrategyMissing ParametersProduct-level metrics and item reports display completely empty fields.Mandate the strict collection of item_id, item_name, and price parameters.Currency MismatchesGross revenue calculations display distorted or over-inflated figures.Ensure the currency variable passes seamlessly in the correct format within your DataLayer.Transaction ID OmissionsThe exact same completed order double-counts across multiple refreshes.Pass a completely unique, non-replicable transaction_id string for every separate checkout order.Failing to properly trigger the standard purchase event within your GA4 event tracking framework makes calculating your actual marketing Return on Investment (ROI) mathematically impossible.5. Deconstructing Data Loss Scenarios: Why Your Metrics Don't MatchIn specific instances, the numbers logging in your analytics dashboard may fail to align with your internal CRM backend or raw sales databases. These are the real-world data loss scenarios you must guard against:Consent Mode Misconfigurations: Under privacy frameworks (like GDPR or KVKK), dropping non-essential tracking cookies without explicit user confirmation is prohibited. If Consent Mode is poorly integrated, the data streams of users opting out vanish entirely. Implementing Advanced Consent Mode allows GA4 to bridge these tracking gaps safely using behavioral modeling.Neglecting Data Retention Settings: Out-of-the-box, GA4 sets its user and event data retention timeline to a mere 2 months. If you fail to manually adjust this parameter to 14 months inside your property settings, you will experience severe data erosion when running historical deep-dive explorations.The Thresholding Phenomenon: If Google Signals is toggled on inside a property that experiences low baseline traffic volumes, Google will automatically withhold specific demographic data segments from your reports to guarantee individual user anonymity. This is a built-in privacy protection mechanism, but it can complicate niche data parsing if misunderstood.6. GTM Configuration Gaps and Debugging OversightsA centralized Google Tag Manager container forms the command deck of your measurement strategy. However, failing to optimize your GTM workspace bogs down frontend page speeds and sparks erratic tag firing.The Most Prevalent GTM Mistakes Include:Overloading containers with massive, legacy custom HTML scripts that slow down browser rendering times.Constructing overly generic trigger rules that accidentally capture unintentional page actions.Publishing workspace changes directly to a live production environment without validating streams via Preview Mode.Mapping improperly named DataLayer variables that fail to capture backend parameters.Executing complex GTM deployments without structured analytics consulting workflows consistently pollutes your marketing databases with structural data noise.7. The Ultimate High-Performance GA4 Audit ChecklistTo systematically verify the tracking health and measurement integrity of your digital infrastructure, run through these diagnostic steps regularly:[ ] Leverage DebugView Natively: Never assume an event configuration works until you monitor its parameters registering in real-time within the GA4 DebugView stream.[ ] Isolate Internal Team Traffic: Implement robust IP filters to exclude your corporate offices, developers, and agency partners. Failing to filter internal traffic distorts your baseline engagement metrics.[ ] Monitor "Unassigned" Volatility: If the "Unassigned" traffic share climbs past 10% in your acquisition tabs, audit your global redirect patterns and UTM naming taxonomy immediately.[ ] Restrict Key Event Scope: Remember that not every interaction deserves equal weight. Reserve your primary "Key Event" (Conversion) designations strictly for transaction-ready milestones like completed purchases or qualified lead forms.Conclusion: Constructing Growth on Clean DataThe key to winning in digital performance marketing is maintaining complete faith in the numbers driving your media spend. GA4 measurement errors and faulty event structures push teams into making flawed strategic assumptions, draining budgets into inefficient buckets. From cross-domain linking to granular e-commerce tracking parameters, every single pixel node must be configured with surgical care.If you maintain any doubts regarding the absolute validity of your digital metrics, exploring comprehensive analytics consulting is the definitive step toward modernizing your measurement infrastructure. At AnalyticaHouse, we eliminate technical roadblocks across your tracking pipelines to ensure you extract high-fidelity business insights. Remember, making decisions based on misconfigured data is significantly more dangerous than flying with no data at all. Turn off the guesswork—clean up your data streams today.
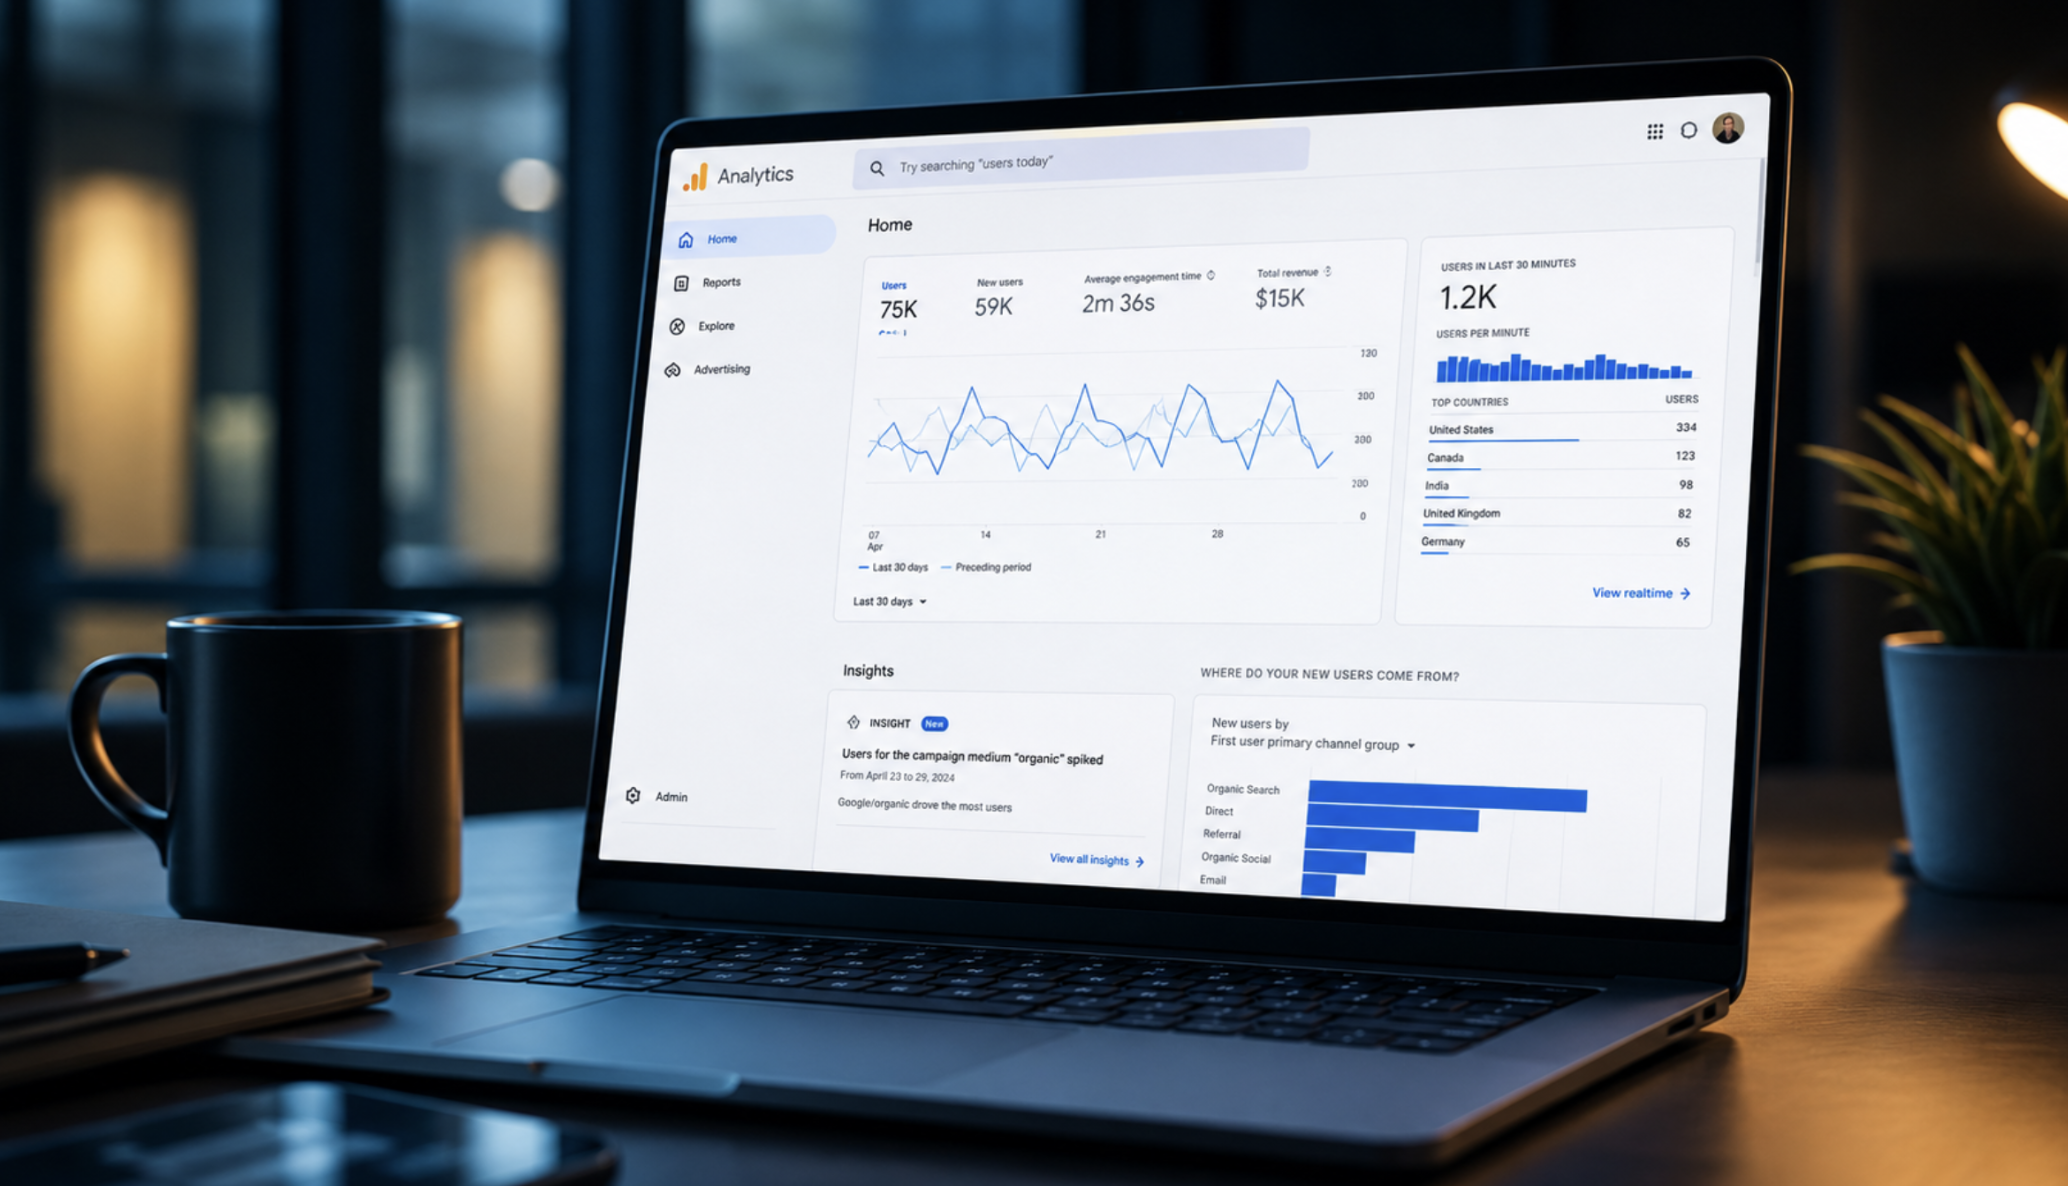
What is GA4? A Brand's Guide to Google Analytics 4
The digital marketing ecosystem has entered a brand-new era where user privacy is paramount and data collection methodologies are continuously evolving. At the center of this transformation sits Google Analytics 4 (GA4), which has fundamentally revolutionized how businesses measure their web and application traffic. In this comprehensive guide, we will deep-dive into what GA4 is, its setup workflows, the core differences separating it from Universal Analytics, and the strategic advantages it offers to your brand.What is Google Analytics 4 (GA4)?Google Analytics 4 is the latest generation web analytics platform developed by Google. Replacing legacy Universal Analytics (UA) properties, GA4 introduces the capability to track not just websites but also mobile applications under a single unified property. The most defining characteristic distinguishing GA4 from its predecessor is its underlying data structure: it no longer processes data using a "session-based" model, but rather relies on a fully "event-based" architecture.Today, actionable user behavior analysis demands a structure capable of mapping complex customer journeys where users constantly hop across multiple distinct devices. Backed by sophisticated machine learning algorithms, GA4 acts as a robust data analysis engine that can intelligently fill tracking gaps and generate forward-looking predictive metrics. This technological leap translates into higher conversion rates and optimized return on ad spend (ROAS) for your business.Universal Analytics vs. GA4: Core DifferencesThe primary reason many marketers experience a steep learning curve during a GA4 transition is the total shift in the metric definitions and data models they relied on for years. The comparison matrix below outlines the critical structural variances between the two ecosystems:FeatureUniversal Analytics (UA)Google Analytics 4 (GA4)Data ModelSession-Based (Sessions & Pageviews)Event-Based (Events & Parameters)Cross-Device TrackingLimited (Device-centric tracking)Advanced (User ID and Google Signals integration)Privacy ComplianceIP Anonymization requires manual setupPrivacy-first by design (Supports cookieless tracking)Predictive AnalyticsNot availablePredictive metrics driven by machine learningBigQuery IntegrationRestricted to GA360 (Paid enterprise) tiersCompletely free for all platform usersAs the comparative data indicates, GA4 is not merely a superficial interface update; it is a profound paradigm shift. Within modern digital analysis frameworks, the question is no longer "How many pages were viewed?", but rather "Which explicit action did the user take, and under what specific context?"Demystifying the Event-Based Data StructureDuring the Universal Analytics era, a user's on-site interactions were segmented into disparate "hit" categories, such as page views, events, or transactions. In the GA4 universe, every single interaction registers as an "event". Even a basic page view is processed in the backend as an event named page_view.This highly flexible event tracking layout equips your brand with powerful analytics advantages:Parameter Richness: You can append descriptive details (parameters) to every event. For example, a video_view event can carry custom variables tracking the video title, its total duration, and the playback resolution.Custom Dimensions: You can easily map custom data variables specific to your precise business goals directly into the reporting interface.Holistic Customer Journeys: A user clicking a button, downloading a file, or submitting a form is evaluated under the exact same data hierarchy, creating a crystal-clear user path.GA4's event-centric model extracts data from static reporting grids and breathes life into it as an integrated ecosystem. Engineering a properly structured event plan forms the foundation of advanced GA4 consulting workflows.How to Set Up GA4: A Step-by-Step Implementation MapSetting up your GA4 architecture correctly is paramount to safeguarding the absolute integrity and long-term validity of your future business analyses. You can execute your initial setup using the following blueprint:Property Creation: Navigate to the "Admin" settings panel in your Google Analytics account and create a brand-new GA4 property.Data Stream Provisioning: Select the appropriate data stream matching your target platform—Web, iOS, or Android.Acquiring the Measurement ID: Once the data stream is provisioned, copy the unique tracking ID prefix starting with G-.Google Tag Manager (GTM) Deployment: We highly recommend using GTM to deploy your GA4 tags seamlessly. Create a "Google Tag" inside GTM and input your unique Measurement ID.Activating Enhanced Measurement: Turn on the "Enhanced Measurement" feature toggle inside your GA4 stream panel to automatically capture standard interactions like scrolling, outbound clicks, and site search queries without extra coding.Technical oversights committed during the initial tag configuration can corrupt data streams, leading to missing or distorted metrics. Investing in professional analytics consulting to perform a thorough deployment audit is highly recommended to protect the health of your long-term business tracking.GA4 for E-Commerce: Real-World Use Case ScenariosFor e-commerce digital platforms, GA4 displays phenomenal capabilities for mapping and decoding conversion funnels. Legacy e-commerce reports have been rebuilt into a far more elastic, deeply granular framework.To execute highly accurate e-commerce data analysis, you should actively track these foundational standard events:view_item: Triggers instantly whenever a user views a specific product detail page.add_to_cart: Measures user interest levels by tracking cart additions.begin_checkout: Signals the initiation of checkout phases; indispensable for diagnosing cart abandonment metrics.purchase: Monitors the ultimate macro conversion, capturing completed sales transactions along with total purchase revenue.An E-Commerce Case Example: If you are managing a digital fashion brand, GA4 enables you to look past basic transaction volumes to uncover which specific product colors or size variations are frequently added to the cart but subsequently abandoned at checkout. Armed with this data, you can optimize your seasonal inventory and supply chain logistics directly.Understanding Metric Variances Between UA and GA4A recurring question brands ask when evaluating data post-transition is: "Why do my historical session counts in Universal Analytics not line up with my new GA4 properties?" This statistical variance is expected and stems from entirely logical differences in platform calculation methodologies:Session Calculation Logic: In Universal Analytics, an active session was automatically terminated at midnight or whenever a user encountered a new campaign tracking parameter. GA4 sessions are completely unaffected by these specific scenarios, meaning you will naturally see fewer—but far more realistic—overall session counts in your GA4 dashboards.Defining Active Users: GA4 strictly prioritizes "Active Users" as its primary user metric, whereas Universal Analytics front-loaded "Total Users" across its native reporting tabs.Engagement Rate vs. Bounce Rate: GA4 calculates bounce rate using an inverse logic, defining it purely as the percentage of sessions that were not engaged. This fundamental shift in definition naturally causes baseline percentages to diverge.Attribution Architecture: GA4 utilizes a "Data-Driven Attribution" model as its out-of-the-box default, whereas Universal Analytics relied heavily on a rigid "Last Non-Direct Click" model.Securing Data-Driven GrowthData functions much like crude oil; it holds immense intrinsic value, but it remains functionally inert until it is refined. Harnessing the full power of GA4's complex yet highly rewarding architecture requires expert navigation. Partnering with data specialists for professional GA4 consulting ensures your event tracking and marketing measurement architectures are built soundly from the ground up.Comprehensive analytics solutions can empower your business through:Delivering deep technical audits alongside customized tracking and measurement blueprints.Implementing server-side tagging architectures to bypass browser tracking limitations and eliminate signal loss.Engineering tailor-made Looker Studio dashboards to distill raw event strings into automated executive insights.Executing targeted conversion rate optimization (CRO) strategies powered by structured user behavior analysis.Conclusion: Construct Your Future on Verified DataGoogle Analytics 4 is far more than a basic reporting dashboard; it is a strategic compass designed to give deep meaning to your digital footprint. Through its advanced event-based architecture, integrated machine learning capabilities, and privacy-first engineering, GA4 has cemented its place as an indispensable pillar of modern digital marketing.If your brand has yet to audit its tracking accuracy, or if you maintain doubts regarding the validity of your current marketing metrics, securing professional analytics consulting is the definitive next step. Every strategic choice made without verified data is simply a guess. Stop guessing your business trajectory—build your future step-by-step on clear data insights.

How to Analyze SEO Performance with GA4
As one of the most dynamic areas of the digital marketing world, SEO has taken on a brand-new identity with the transition to Google Analytics 4 (GA4). Unlike traditional Universal Analytics (UA), GA4's event-based data model allows you to examine the user journey much more deeply. GA4 SEO analysis now goes far beyond simply counting clicks and sessions, enabling you to understand how visitors interact with your website and to what extent organic traffic contributes to your business goals.In this guide, prepared with AnalyticaHouse expertise, we will cover in full detail how to structure an SEO performance analysis process on GA4, the critical metrics you need to focus on, and how to measure the impacts of AI Overviews—the new reality of the modern SEO world.1. The Importance of Search Console and GA4 IntegrationTo begin a comprehensive SEO data analysis process, the first thing you need to do is connect your Google Search Console (GSC) data to the GA4 interface. Thanks to this integration, you can track users' behavior before they reach your site (queries, impressions, click-through rates) alongside their actions after arriving on your site (conversions, engagement time) all within a single panel.You can follow these steps to set up the Search Console analysis on GA4:Go to the "Product Links" section within the Admin panel.Select Search Console links and match your property.Once the link is complete, publish the Search Console reports using the "Library" tool in the "Reports" section.Once this connection is active, you can clearly see which keywords supply your most valuable organic traffic analysis data and which pages perform more efficiently in search engine results pages (SERPs).2. Organic Landing Page Analysis: Optimize User Entry PointsThe success of your SEO strategy depends directly on which pages users land on via organic searches and how much time they spend on those pages. Landing page analysis reveals which of your content pieces are deemed authoritative by Google and how effectively you satisfy user intent.To examine organic landing pages in GA4, navigate to "Reports > Engagement > Landing Page". Utilizing the "Session Source / Medium" filter here to focus exclusively on "google / organic" data will yield healthier analytical results.Key Metrics to Analyze for SEO Performance:Average Engagement Time per Session: Demonstrates whether your content effectively meets user expectations.Key Events (Conversions): Helps you measure the actual commercial value driven by your organic traffic.New Users: Reveals your website's potential to reach entirely new audiences.If you have pages that receive high traffic volumes but suffer from low engagement times, you must re-evaluate them from a technical SEO or content quality perspective. Securing professional analytics consulting at this stage plays a critical role in helping you identify hidden anomalies within your data sets.3. Relationship Between Engagement Rate and SEO: Moving Beyond Bounce RateThe traditional "Bounce Rate" we were accustomed to during the UA era has been replaced in GA4 by a much more meaningful metric: "Engagement Rate". In the SEO world, this shift represents a true revolution for measuring user experience. In Google Analytics 4 SEO strategies, a user's session is counted as an engaged session if they stay on your page for more than 10 seconds, trigger at least one conversion event, or view at least two pages.When conducting user behavior analysis, identify pages with declining engagement rates and ask yourself the following questions:Is page load speed frustrating the user? (Core Web Vitals impact)Does the content truly align with the targeted keyword's intent?Are the internal linking structures or visual assets sufficient to keep the user engaged?4. Measuring AI Overview Impacts: The New Frontier of SEOGoogle's generative AI-driven search results, known as AI Overviews, have pushed SEO performance analysis beyond conventional methodologies. Users can now read a summarized text generated by AI before ever clicking through to a website. While this shift can lead to organic traffic drops for informational queries, it also introduces premium, high-quality traffic opportunities by citing your site as a referenced source.You can utilize the following methods to indirectly measure the impacts of AI Overviews via GA4:Query-Based Analysis: Closely monitor the click-through rates (CTR) of informational queries within Search Console. If you detect drops where AI Overviews are highly active, optimize your content into a "direct answer" format that AI models can easily reference.Branded Traffic Monitoring: If AI engines recommend your brand as an authority, you can validate this impact by observing a steady lift in your direct brand search queries.Exploration Reports: Build custom timelines to compare traffic fluctuations on specific pages against major AI Overview rollouts to accurately analyze the underlying correlation.5. Creating a Custom SEO Dashboard: Make Sense of Your DataStandard out-of-the-box reports can sometimes lack the clarity required for complex tracking. Because of this, engineering a custom SEO dashboard allows teams to monitor overall project health at a single glance. The "Explore" section in GA4 is ideal for constructing free-form data tables and funnel analyses.We highly recommend including the following reporting components inside an effective SEO performance analysis panel:Organic traffic trends segmented by custom channel groupings.The top 20 organic landing pages driving the highest traffic volumes.A clear device-category comparison (mobile vs. desktop) of your organic performance.E-commerce revenue or form completion conversion volumes originating strictly from organic search.SEO Dashboard Visualization Matrix:DimensionMetricVisualization FormatFirst User Source / MediumNew UsersTimeline ChartLanding PageEngagement RateData TableDevice CategoryAverage Session DurationPie Chart6. User Behavior Analysis and Path ExplorationsSEO does not simply end once you attract organic traffic to your website; the true process continues by convincing that traffic to convert. The "Path Exploration" tool within GA4 allows you to trace the exact sequential steps an organic visitor takes after entering your site. For example, seeing whether a user moves to a commercial service page or directly to a contact form after reading a blog post carries immense value for your user behavior analysis.If visitors are dropping off rapidly following an organic landing, you can leverage "Content Grouping" features to isolate via SEO data analysis which specific categories (e.g., informational guides vs. transaction-ready product reviews) yield superior business results.7. Transforming Data into StrategyIn today's digital environment, GA4 SEO analysis is an absolute necessity for website success. You must go beyond merely watching the data; you need to decode its meaning and transform it into concrete, actionable steps. Every measure you take—from Search Console integration and engagement rate optimization to tracking AI Overview correlations and developing custom dashboards—will dictate your site's perceived value in the eyes of Google.At AnalyticaHouse, we are always ready to help you convert complex data matrices into strategies that serve your overarching business objectives. If you want to maximize your site's organic performance and create a definitive edge through in-depth analytics consulting, it is the perfect time to explore our professional solutions. Remember, you cannot improve what you do not accurately measure.

What is Funnel Analysis? Where Are Users Getting Lost?
In digital marketing and product management workflows, the critical process that begins with a user stepping onto your website and culminates in a final objective (such as a purchase, registration, or form submission) is called the "user journey". However, not every user completes this journey successfully; a vast majority choose to drop off at some point along the way. This is exactly where funnel analysis steps in to save the day. Funnel analysis is one of the most powerful data analysis methodologies that allows you to determine which stages your users pass through during this journey, where they hesitate and abandon the process, and which areas you need to improve to boost your conversion rates.In this guide prepared by AnalyticaHouse, we deep-dive into how you can structure an effective conversion funnel, analyze why and where your users are disappearing, and evaluate which analytics tools and strategies you should focus on to minimize these losses.Funnel Analysis and Core ConceptsWhy do we use the "funnel" metaphor? The reason is quite simple: while a massive volume of users enters through the wide mouth of the funnel (the awareness stage), only a specific percentage successfully exits through the narrowing bottom part of the funnel (the conversion stage). Funnel analysis allows you to pinpoint exactly where and how intensely this narrowing occurs.To anchor your analyses on a healthier foundation, you must clarify the distinction between these two concepts:Macro Conversion: This is the primary objective of your business. For an e-commerce site, this is an order confirmation, while for a SaaS platform, it is the completion of a subscription plan.Micro Conversion: These are the small but highly valuable steps taken on the path toward the macro conversion. For instance, adding an item to the cart, watching a promotional video, signing up for a newsletter, or reading customer testimonials are all distinct micro conversions."Conversion rate optimization (CRO) is not just about focusing on the final step; it is the art of improving micro conversions to prepare the user for the macro conversion step-by-step."A Critical Stop in the User Journey: The Checkout FunnelFor e-commerce sites and digital platforms, the most critical funnel phase is usually the checkout process. You must meticulously analyze this area where the user's purchase intent is at its highest, yet where they might abandon the process over the slightest bit of friction. Lowering user drop-off metrics is absolutely vital for your business's net profitability.Example of a Structured Checkout FunnelThe table below outlines the standard steps within an e-commerce checkout funnel and highlights the key metrics you need to trace:StageUser ActionMetric to AnalyzePotential Drop-off Cause1. Cart ViewAdding the product to the cart and opening the cart page.Cart Addition Rate.High shipping fees, missing coupon codes.2. Information EntryFilling out delivery and billing details.Form Completion Time.Too many mandatory fields, complex form layouts.3. Shipping SelectionSelecting the shipping methodology.Shipping Page Abandonment Rate.Unexpected additional costs, prolonged delivery times.4. Payment PageInputting credit card information.Payment Error Rate.Lack of trust indicators, limited payment alternatives.5. Successful TransactionLanding on the "Thank You" confirmation page.Overall Conversion Rate (CR).Technical system glitches, bank approval errors.Where Are Users Disappearing? Drop-off AnalysisWhen your users choose to abandon the sequence instead of advancing from one stage to the next, we call this a "drop-off". Pinpointing these drop-off points utilizing product analytics tools is essentially a form of digital detective work. So, what are the primary reasons users pull out of the system?1. Technical Flaws and Performance RoadblocksIf a page fails to load or a form throws an error when a user clicks a button, it acts as the fastest catalyst for abandonment. When running your data analysis, if you notice the drop-off rate spiking abruptly on a specific web browser or device model, it almost always points to an underlying technical glitch.2. User Experience (UX) and Friction PointsThe more effort a user has to exert to complete a transaction, the further they drift from converting. For example, failing to provide a Guest Checkout option can cause you to lose numerous users at the very start of the process.3. Hidden or Unexpected CostsThe variance between the price a user sees in their cart and the final sum presented at the payment step (with added taxes and shipping) builds a severe psychological barrier. In user behavior analysis reports, this lack of transparency consistently ranks as the leading cause of cart abandonment.Essential Tools for Actionable CRO AnalysisRelying solely on quantitative data from platforms like Google Analytics will only tell you what happened; to grasp the underlying why, you must integrate qualitative tools. The following toolkits can guide your conversion rate optimization workflows:Heatmaps: Visualizes exactly where users click and move their cursors on a page. This allows you to clearly see if a critical button is being completely ignored.Session Replays: Allows you to review real-time user sessions just like a video. This is invaluable for tracking where a user hesitates or where they experience a "rage click".Form Analytics: Identifies which specific form field triggers friction or causes users to stop filling out the form entirely.A/B Testing Tools: Allows you to measure the exact conversion impact of a subtle modification on the funnel (such as changing a button color or editing CTA copy).The Power of Micro Conversions: Expanding the Funnel MouthMany businesses miss the big picture by fixating exclusively on the final "Purchase" button. In reality, the path to a macro conversion is paved with micro conversions. You might not convince a user to buy immediately, but pulling them into the funnel via a newsletter signup is a major micro win.Vital Micro Conversion Examples:Reviewing multiple product images on a detail page.Clicking on helpful information links like a "Size Guide" or "Shipping Policy".Adding an item to a personal wishlist.Activating a live chat or support window.Sorting and reading through customer reviews.These actions indicate that the user possesses high intent but still requires more data or trust validation. Optimizing these micro steps during your CRO analysis will systematically drive up your primary macro conversion rates over time.Strategies to Plug Funnel Leaks via Data AnalysisTransitioning from the analysis phase to the action phase requires a precise interpretation of the data captured through your analytics tools. You can execute the following strategies to fix leaks:Tips to Mitigate User Abandonment RatesLeveraging Social Proof: Position customer reviews or prominent trust badges (SSL, verified payment logos, etc.) close to payment interaction fields to clear the trust barrier.Streamlined Forms: Request only the absolute bare minimum data you need. Swap manual text fields for automated address-completion APIs.Exit-Intent Popups: Deploy a timely popup offering an exclusive discount or custom deal when a user is about to abandon the page, re-engaging them back into the funnel.Speed Optimization: Keep in mind that every single 1-second delay in page load time can plummet conversion rates by roughly 7%.Conclusion: The Imperative of Continuous OptimizationRemember that funnel analysis is not a one-and-done project you can archive; it is a continuous cycle. As user habits, underlying technologies, and market dynamics pivot, the user journey evolves alongside them. Routine monitoring of product analytics data to detect bottlenecks early and refine user experiences remains the absolute key to sustainable growth.At AnalyticaHouse, we empower you to optimize your business's conversion funnels through data-driven strategies. Knowing where your users are getting lost is the first step toward understanding how to win them back. Through accurate data analysis methodologies and structured CRO analysis frameworks, you can transform every phase of your funnel into a fresh opportunity.If you are ready to lift your digital performance to the ultimate tier and diagnose the leaks in your conversion funnel with a professional team, it is the perfect time to explore the expert capabilities of AnalyticaHouse.

Can Sales Forecasting Be Done with Data Analytics?
In today's digitized business world, data is not merely a byproduct; it is the most powerful fuel for your strategic decisions. One of the most critical questions you likely ask about the future of your business is: "Can we predict how much we will sell in the future, starting today?" The answer to this question lies within modern data analytics methodologies. Manual calculations left on the dusty shelves of the past have been replaced by smart algorithms that process millions of rows of data in seconds. In this guide, we will analyze how the sales forecasting process has transformed into a branch of science and explore the opportunities that the world of predictive analytics offers to you.Sales forecasting is the process of predicting the revenue your company will generate in a specific time frame. However, rather than a simple guessing game, this projection is a seamless combination of data analysis, market trends, and statistical models. When you establish an accurate forecasting framework, you can optimize all your operational processes, from inventory management to marketing budget planning. At AnalyticaHouse, we guide you in achieving your sustainable growth targets by leveraging the power of data.The Relationship Between Sales Forecasting and Predictive AnalyticsWhile traditional methods generally focus on the question "How much did we sell this month last year?", predictive analytics allows you to search for answers to the question "How much will we sell next month, and why?" Predictive analytics uses machine learning and statistical algorithms to forecast future results based on your historical data. At this point, revenue forecasting ceases to be just a number and becomes a strategic roadmap for you.A data-driven sales forecasting process consists of these fundamental components:Historical Data Sets: Your sales figures, customer behaviors, and transaction history.External Factors: Variables such as economic indicators, competitor pricing, and weather conditions.Statistical Models: Regression analysis, time-series analyses, and artificial intelligence models.The core differences between traditional forecasting methods and data-driven forecasting are highlighted in the comparison table below:FeatureTraditional Sales ForecastingData Analytics-Driven ForecastingCore BasisIntuition and past experiences.Big data and algorithms.PrecisionMargin of error is high.High accuracy and low deviation.Data SourceLimited (Internal sales data only).Comprehensive (Internal and external multichannel data).UpdatabilityStatic and slow.Dynamic and updatable in real-time.The Critical Importance of Using Historical DataThe success of a sales forecasting model depends directly on the quality and depth of the data that feeds it. Using historical data is the most vital stage in the algorithm's learning process. The further back your data goes and the cleaner it is, the more robust your model becomes. However, simply possessing the data is not enough; you must correctly interpret its meaning.The data cleaning process involves filling in missing data, filtering out outliers, and normalizing the data sets. For example, if a major campaign period from the previous year is not flagged as an "anomaly" in the model, it could artificially inflate your future forecasts. As a firm pursuing a data-driven growth strategy, you must utilize data in its processed and filtered form rather than its raw state.Seasonality Analysis: Understanding Sales TrendsYour sales figures never progress in a perfectly linear direction. Especially in the retail and e-commerce sectors, seasonality analysis is considered the heart of forecasting models. Holidays, special occasions (Black Friday, Valentine's Day), seasonal transitions, and even the specific day of the month directly impact your sales performance.When performing a sales trend analysis, you must examine three core components:Trend: The long-term general upward or downward trajectory of your sales.Seasonality: Patterns that repeat at specific time intervals (weekly, monthly, annually).Irregular Variables: Fluctuations resulting from unexpected events (such as pandemics or economic crises).When you accurately analyze the effects of seasonality, you can prepare inventory ahead of peak demand periods or develop new campaign strategies using aggressive analytics solutions during low-demand periods.Artificial Intelligence Analysis and Modern Forecasting ToolsAt the points where traditional statistical models (such as ARIMA or Exponential Smoothing) fall short, artificial intelligence analysis enters the equation. Deep learning and artificial neural networks possess the capability to capture complex patterns that the human mind might miss. AI-supported forecasting tools process thousands of different variables simultaneously to generate realistic simulations for you.Some business intelligence and forecasting tools widely used in the business world today include:Tableau & Power BI: Offer data visualization and core forecasting modules.Google BigQuery ML: Enables you to build machine learning models using SQL.Facebook Prophet: A library specifically developed to capture seasonality in time-series data.Python & R Libraries: Used to develop customized deep analytical models based on your specific business requirements.These tools do not just tell you how much you will sell; they also reveal which products will perform better in which marketing channels. Thanks to artificial intelligence analysis, it is possible to reduce your incorrect inventory costs by 20% to 50%.Data Analytics Examples in the E-Commerce SectorE-commerce is one of the primary areas where data is most concentrated and sales forecasting applications yield the fastest results. Your users' on-site click data, cart addition rates, ad spend, and historical purchases constitute the most valuable treasure in your hands.Let's look at an e-commerce scenario: Suppose your brand wants to predict which coat models will sell more before the winter season using predictive analytics. Your model delivers a report by combining past winter sales, search volumes on Google Trends, and meteorological forecasts. As a result, you plan your inventory with high accuracy and eliminate out-of-stock costs.Furthermore, revenue forecasting in e-commerce plays a critical role in the channel-based distribution of your ad budgets (Google Ads vs. Meta Ads). You can estimate in advance which channel will provide a higher Return on Investment (ROI) using advanced data models.Strengthen Decision-Making Mechanisms with Business Intelligence (BI)Collecting and analyzing data is only half the battle. The other half is presenting this information to decision-makers in the simplest and most understandable way. Business intelligence tools ease your workflow by transforming the outputs of complex algorithms into executive summaries and interactive dashboards.An effective BI strategy provides you with the following:Instant Monitoring: Real-time comparison of your sales targets against actual generated figures.Anomaly Detection: Automatic system warnings whenever a significant deviation from forecasts occurs.Scenario Analysis: Finding concrete answers to questions like "How would our sales be affected if we increased our ad budget by 10%?"As a company that integrates data analysis processes with BI tools, you can react much faster to market changes and outpace your competitors.Data-Driven Growth with AnalyticaHouseThe world of data analytics may appear complex from the outside; however, with the right partner, you can turn this complexity into a massive opportunity. At AnalyticaHouse, we support your data-driven growth journey by transforming the data your business owns into a valuable asset. We remove uncertainties from your life with a wide range of analytics solutions, from sales forecasting to user segmentation.Making a sales forecast is not just a mathematical operation; it is a projection cast onto the future of your business. If you want to build your future with data instead of guessing it, you are in the right place. Thanks to predictive analytics and modern data architectures, you can take every step with greater confidence and manage your resources in the most efficient manner.In SummaryYes, making sales forecasts with data analytics is not only possible but a necessity today. You can save your business from being left to chance through correct data analysis techniques, seasonality analysis, and artificial intelligence support. Remember that companies unable to read the data in their hands are like ships sailing without a compass. At AnalyticaHouse, we are ready to be your compass on this journey.To discover future sales trends starting today and perfect your revenue forecasting models, you can begin investing in data-driven strategies immediately. Because data does not mislead; it simply waits to be interpreted correctly.