

Marketing tips, news and more
Explore expert-backed articles on SEO, data, AI, and performance marketing. From strategic trends to hands-on tips, our blog delivers everything you need to grow smarter.

What is Product Analytics? A Guide to Growing Digital Products with Data
In today's digital landscape, developing a mobile application or a SaaS (Software as a Service) platform is merely the first step toward success. The real challenge lies in understanding how users engage with your product, discovering which features truly generate value, and continuously optimizing the experience. This is exactly where the concept of product analytics comes into play. Product analytics is a critical discipline that sits at the center of modern product management, allowing intuitive guesswork to be replaced by concrete data.Let's explore the foundational pillars of product analytics workflows, the methodologies used to analyze user behavior, and how to place data at the core of your growth strategies. At AnalyticaHouse, we explain step-by-step how you can transform your digital products into sustainable growth engines.What is Product Analytics?Product analytics is the process of tracking, making sense of, and visualizing the interactions that users establish with a digital product. This process goes far beyond superficial vanity metrics like "How many people downloaded the app?". Instead, it searches for answers to strategic questions such as: "Why do users abandon the product at a specific stage?", "Which features drive retention?", or "What are the shared behavioral traits of your most valuable user segments?".The analytics solutions you deploy transform every click and action into a data point, equipping your product teams with the following capabilities:Pinpoint bottlenecks and friction points across the user journey.Accurately measure the actual adoption and usage rates of product features.Group users into behavioral segments to deliver highly personalized experiences.Ground your product decisions on concrete evidence rather than assumptions.The Synergy Between Data and Product-Market Fit (PMF)The most fundamental metric that determines the ultimate success of a startup or a new product feature is capturing Product-Market Fit (PMF). PMF demonstrates how effectively your product satisfies a strong demand in the market. Without leveraging product analytics, it is exceptionally difficult to identify whether or not you have achieved this alignment.When running a data-driven PMF analysis, you must closely monitor these foundational metrics:Usage Frequency: How regularly do your users interact with the core functionalities of the product?Retention Curve: What percentage of users remain active after a specific time horizon?Net Promoter Score (NPS): Are your users satisfied enough to actively recommend your product to others?User Behavior Analysis: Core Metrics and ConceptsTo scale a digital product, you must shift your focus past merely driving raw traffic to analyze the user's entire lifecycle inside the platform. When conducting user behavior analysis, you must master these core concepts:1. Retention AnalysisRetention analysis is the single most critical metric determining the long-term success of a product. As the financial cost of acquiring new users scales up every day, retaining existing users directly dictates your net profitability. Retention enables you to measure how frequently users return to the platform after their initial interaction.2. Churn AnalysisChurn analysis helps you diagnose exactly why and at what specific point users stop interacting with your product. Especially within SaaS business models, subscription cancellations are defined as the "churn rate". Methodically driving down this rate is vital for the long-term sustainability of your product.3. Funnel AnalysisFunnel analysis places the exact sequence of steps a user takes to reach a specific objective (such as registration or a completed purchase) under a microscope. This layout allows you to observe exactly which stage triggers the highest volume of user exits (drop-offs). For example, a sudden drop-off on a payment page can point directly to a technical script glitch or an overly complex input form.Product Analytics Software: Amplitude vs. MixpanelWhile the digital market offers various product analytics tools, Amplitude and Mixpanel stand out as the industry leaders due to their deep behavioral analysis capabilities. Platforms like Google Analytics focus heavily on traffic acquisition sources, whereas these specialized tools analyze direct user actions inside the interface.BI Tool Comparison Overview: Amplitude vs. MixpanelFeatureAmplitudeMixpanelCore FocusUser behavior paths and predictive analytics.User engagement flows and funnel optimization.SegmentationDeep, multi-layered behavioral cohort frameworking.Fast, intuitive, and highly visual segmentation UI.Retention AnalysisIdentifies key activation loops via "Compass" reports.Generates clear, high-velocity retention data matrices.ExperimentationRobust, native A/B testing engine (Amplitude Experiment).Flexible, frictionless integrations with third-party tools.Isolating which platform fits your organization best depends heavily on your team's technical data maturity and the inherent structural complexity of your product. When selecting analytics solutions, prioritize data integrity and integration elasticity.Sector Applications across SaaS and Mobile App EcosystemsSaaS Case Scenario: Imagine operating a project management software. If your data reveals that 60% of new signups fail to click the "Create New Project" button within their first 3 days, you are facing a critical onboarding friction barrier. Running a user experience analysis allows you to trigger targeted in-app walkthrough guides to assist these users, systematically lifting your long-term retention metrics.Mobile App Case Scenario: Within a mobile gaming application, your metrics might expose a massive wave of users abandoning the game immediately after reaching level 5. Running a funnel analysis can reveal that this specific level is either mathematically overtuned or contains a severe technical bug. Deploying the necessary product optimizations will rapidly lower your churn rates.Structuring a High-Performance Data-Driven Growth StrategyTo engineer a highly successful, data-validated growth framework, execute these strategic steps:Isolate High-Value Key Events: Avoid tracking every single arbitrary click; instead, focus strictly on the key actions that generate core user value (e.g., streaming a video, starting a subscription).Define Your North Star Metric: Establish a single, overarching metric that represents the primary value your product delivers and aligns all internal teams (e.g., "Total Listening Time" for Spotify).Construct and Validate Clear Hypotheses: Develop crisp optimization statements, such as: "Simplifying the registration inputs from 5 fields to 3 will boost conversion rates by 10%," and validate them through strict A/B testing loops.Sustain the Optimization Cycle: Interrogate the data, execute targeted actions, measure the exact performance yield, and repeat the cycle continuously.Conversion Rate Optimization Powered by User Experience AnalysisProduct analytics is far more than an array of cold numbers; it provides high-fidelity answers to the "why" behind the telemetry. User experience analysis seamlessly merges quantitative metrics with qualitative insights. By backing your data streams with visual heatmaps, individual session recordings, and targeted user surveys, you gain unparalleled clarity into the exact roadblocks your users face.For instance, while a quantitative funnel analysis highlights that a specific page suffers from a severe drop-off rate, your qualitative user experience analysis can expose that the primary CTA button on that layout renders too small to be tapped comfortably on mobile screens. Capturing this holistic view creates the single greatest edge for the commercial success of digital products.Conclusion: Construct Your Strategy on Verified ActionIn an intensely competitive digital marketplace, managing a product purely through intuition is equivalent to navigating in total darkness. Product analytics acts as the ultimate lighthouse, illuminating the terrain and showing you the true, verified needs of your users.Building a loyal user base through retention analysis, minimizing customer erosion via churn diagnostics, and optimizing every interface stage with the right analytics solutions is the only viable path to sustainable growth. Cultivating an authentic data-driven culture does not start with purchasing expensive software; it begins with developing the strategic vision required to render that data actionable.To maximize your digital product's absolute potential and capture a definitive edge through deep behavioral tracking, partnering with specialized experts is an invaluable step. At AnalyticaHouse, we are fully equipped to guide you across every stage of your data-driven growth journey.

How Data-Driven Decision Making Shapes the Future of Your Business
In today's rapidly changing business world, securing a competitive advantage using traditional methods is becoming more difficult with each passing day. Relying solely on your experiences or intuition is unfortunately no longer enough for your company to survive and capture a sustainable growth trajectory. At the center of the modern business landscape sits the concept of data-driven decision making. Transforming your raw data into meaningful insights does not just maximize your operational efficiency; it directly dictates your company's future positioning.Serving as the most critical link in your digital transformation journey, data analytics ensures that your strategic moves are backed by concrete evidence rather than guesswork. At AnalyticaHouse, let's explore how data must be woven into your institution's DNA, why intuitive approaches fall short, and what a properly structured analytics strategy can bring to your business.Intuitive Decision Making vs. Data-Driven Decision MakingIn the past, managers navigated using intuitive methods that they labeled as "market sentiment" or "experience". However, within today's complex data ecosystem, it is nearly impossible for the human brain to process millions of distinct signals simultaneously to uncover the most accurate outcome. Data analysis, conversely, connects you with objective, scalable, and emotion-free results.Comparison Matrix: Intuitive vs. Data-Driven DecisionsFeatureIntuitive Decision MakingData-Driven Decision MakingCore BasisPersonal experiences and feelings.Concrete data and statistical models.Risk LevelHigh margin of error and highly subjective.Predictable and heavily minimized risks.SpeedInstantaneous but can be highly inconsistent.Rapid and highly consistent once processes are set.ScalabilityDifficult; relies heavily on specific individuals.Effortless; grounded in systems and algorithms.Future VisionProne to being stuck in past patterns.Powered by forecasting systems (Predictive Analytics).While intuitive decisions frequently cause teams to fall into the trap of assuming "it worked in the past," data analytics processes allow you to capture shifting market dynamics and user behaviors in real-time. This approach will trigger a direct multiplier effect on your overall business performance.Data Culture: Injecting a New DNA into Your CompanyBecoming a data-driven enterprise requires more than just purchasing advanced software or owning massive data repositories. The most challenging yet rewarding phase of this transformation is engineering an authentic data culture. A data culture implies that every single employee across your organization—spanning marketing, operations, HR, and finance—turns to data to validate decisions and embraces data as a shared language.Foundational Steps to Build a Robust Data Culture:Data Access Democracy: Ensuring data does not remain locked within a monopoly held by upper management or the IT department; all relevant departments must enjoy secure, rapid access to the data fields they require.Data Literacy: Planning routine training operations to ensure your workforce knows exactly how to read, interpret, and challenge data sets.Freedom to Question: Believing in the power of verified metrics over traditional corporate hierarchies, meaning a tangible data point presented by an intern should be deemed more valuable than the intuitive opinion of a director.Single Source of Truth: Guaranteeing that all internal departments converse over consistent reports tied to the exact same underlying data strings.Business Intelligence (BI) and Your Strategic MovesBusiness intelligence (BI) frameworks encompass the collection, cleaning, and visual presentation of your scattered data sources to key decision-makers. A properly engineered BI infrastructure shifts your company's focus past just asking "What is happening?" to deeply analyze "Why is it happening?" and "What will happen in the future?"Operational Advantages Earned Through BI Tools:Operational Efficiency: Grants absolute visibility into which specific workflows trigger time blocks, showing exactly where you can optimize operational costs.Real-Time Monitoring: Tracks your core KPIs (Key Performance Indicators) continuously, allowing managers to intervene and defuse potential crises before they scale.Market Share Analysis: Follows competitor actions and broader market trends via data to identify fresh business opportunities early.Data-Driven Marketing and User AnalyticsThe marketing landscape stands as one of the premium sectors where data is deployed with maximum effectiveness. Data-driven marketing is an architecture that prevents your media spend from draining into inefficient buckets, maximizing the return on every single dollar spent. This is exactly where user analytics steps in; you can design highly personalized strategies by analyzing your visitors' on-site user journeys, click-through rates, cart addition habits, and customer Lifetime Value (LTV/CLV).A Retargeting Use Case: If you run an e-commerce platform, user analytics can help you identify exactly which customer segment demonstrates a high propensity to churn. The win-back campaigns you deploy to re-engage these users can only capture success through these data-driven, predictive insights. These segments form the marketing core of your overarching digital transformation journey.AI-Powered Analytics: The Future is HereModern data analytics has expanded beyond historical reporting to integrate directly with artificial intelligence (AI) and machine learning (ML) models. AI-powered analysis captures complex behavioral patterns that the human eye might miss, processing them in fractions of a second.Core Advantages of AI and Data Analysis Integration:Predictive Analytics: Foresees your future sales volumes or seasonal inventory requirements with high-fidelity accuracy.Natural Language Processing (NLP): Automatically parses customer text reviews and feedback strings to execute systemic sentiment analysis.Automated Anomaly Detection: Flags unusual spikes or drops across financial transactions or web traffic instantly, alerting teams to potential security gaps or technical rendering bugs.Autonomous Decision Engines: Enables AI models to execute real-time operational choices within pre-set parameters, such as deploying dynamic pricing algorithms.Real-World Corporate Case ScenariosTo illustrate the stark contrast data-driven decision making brings to a business, let’s analyze two practical use cases:Scenario 1: Inventory Management and Supply Chain LogisticsImagine operating a standard retail chain and intuitively deciding to distribute identical coat inventories across all country branches because "sales naturally lift during winter months". However, when running a thorough data analysis, you discover that your coastal stores rapidly sell out of lightweight jackets while your eastern mountain branches exclusively deplete heavy thermal gear. Migrating to a data-driven approach allows you to execute region-specific stock allocations, systematically driving down warehousing costs while eliminating missed sales opportunities.Scenario 2: Customer Success and Product DevelopmentSuppose you run a software enterprise and plan to develop a complex fresh feature because your product team assumes it feels "highly appealing". Yet, analyzing your user behavior metrics reveals that 70% of your active user base is actually dropping out over a clunky interface component, requesting a clean UI/UX optimization instead. By listening to the data, you can shift your development budget directly toward what your users genuinely need, accelerating customer satisfaction and driving up Net Promoter Scores (NPS).Why Analytics Consulting is VitalWhile numerous organizations possess access to data, structuring clean processing pipelines and transforming raw numbers into strategic outputs remains a complex challenge. Fragmented data silos, tracing vanity parameters, or running flawed modeling configurations will lead teams to make costly strategic errors. This is exactly why securing professional analytics consulting is critical.A Dedicated Consulting Partnership Empowers Your Business By:Establishing robust, privacy-first data collection architectures (such as Google Analytics 4 and server-side tracking loops).Defining precise KPI sets customized to serve your specific commercial business targets.Merging chaotic multi-layered metrics into automated, crystal-clear executive data visualization panels.Engineering data-driven growth frameworks (Growth Hacking) to systematically scale performance.Conclusion: Data-Driven Enterprises Will Lead the MarketData-driven decision making is no longer a luxury strategy; it is an absolute survival requirement. Placing data at the center of your operations grants you a powerful lighthouse to navigate an unpredictable business landscape. Viewing data as your single most valuable corporate asset rather than a generic digital byproduct throughout your digital transformation journey will keep your brand multiple steps ahead of the competition.At AnalyticaHouse, we stand by you along your data exploration path, developing customized business intelligence and data analytics frameworks to help you write sustainable success stories. If you are ready to construct your enterprise's future on the unassailable power of data, take your first step today by building a verified analytics strategy.
How to Improve User Experience with Session Recording Tools
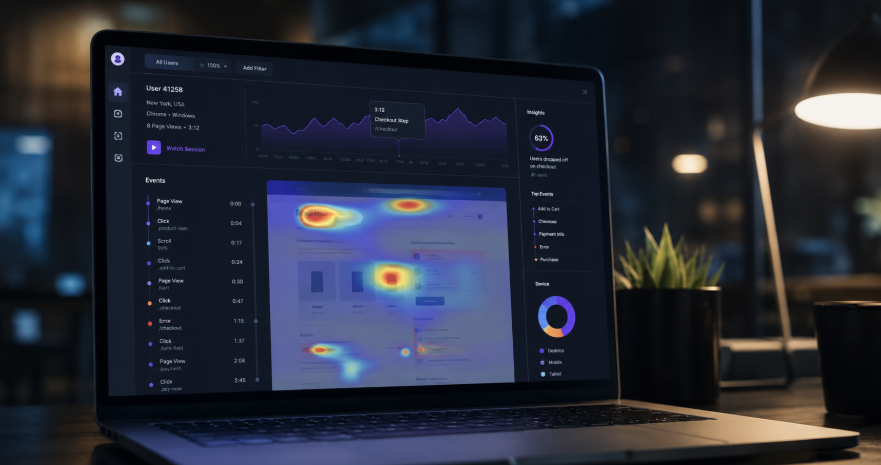
In the digital world, it is not always possible to understand exactly what your users are doing on your website or mobile application by looking at numbers alone. While traditional analytics tools like Google Analytics tell you what happened (such as visitor numbers or session duration), session recording tools explain the why behind that data. Anonymous user behavior recording technologies, which allow you to observe users' real-time movements, friction points, and primary motivations, have become an indispensable part of modern digital marketing and product development strategies today.In this guide prepared by AnalyticaHouse, we deep-dive into how you can integrate session recording (session capture) workflows into your UX analysis frameworks, which user experience optimization metrics are critical, and how to structure Conversion Rate Optimization (CRO) strategies to maximize your digital performance.What is Session Recording and Why Does It Matter?In its simplest terms, session recording is a technology that allows you to anonymously record a user's on-site interactions—including mouse movements, clicks, scrolls, form completion inputs, and page changes—and play them back like a video. These playback recordings go far beyond dry data tables, enabling your product teams to build direct empathy with your actual users.When analyzing user behavior, leveraging session recording software delivers the following foundational advantages:Pinpointing Friction Points: You can directly observe the exact step where users hesitate or why they choose to abandon a specific transaction process.Visual Debugging: You can visually isolate technical errors and rendering bugs that show up only on specific web browsers or mobile device models, dramatically accelerating your resolution timeline.Hypothesis Validation: You can gain definitive clarity on how users actively respond to new interface layouts before and after launching complex A/B tests.Providing Visual Evidence: Rather than trying to explain theoretical user experience flaws to internal stakeholders, you can present video proof of user obstacles to accelerate corporate buy-in.Deconstructing Rage Clicks and Their Impact on UXOne of the most critical signals you will encounter during a user experience analysis is the presence of "Rage Clicks". When a user rapidly and repeatedly clicks on the exact same spot within a short timeframe, it signals that the interface is failing to deliver the expected response. This behavior highlights an immediate need for structured user experience optimization.The most prevalent user rage click scenarios include:Static, Non-Clickable Elements: A user mistakes an image, layout card, or text snippet for a hyperlink and clicks it. If the asset lacks interaction logic, it points to a clear design flaw in your visual navigation hierarchy.Unresponsive Submission Buttons: If a form-submit button triggers a backend error or suffers from a sluggish response time, frustrated users will repeatedly click the CTA.Slow Content Loading Speeds: When elements load slowly on mobile devices, users assume the page has frozen or crashed and begin tapping randomly all over the screen.Broken Navigation Links: Clicking an explicit action item that triggers zero technical responses ranks as one of the single highest sources of user frustration.Form Abandonment Scenarios and Resolution StrategiesFor digital storefronts and B2B lead generation platforms, experiencing a drop-off mid-way through a form submission process is exceptionally painful. Leveraging the form analytics modules built into modern CRO tools allows you to isolate exactly which input field is chasing users away.The most frequent form abandonment scenarios include:Intrusive Data Demands: Demanding unnecessary personal information, such as phone numbers or government IDs, immediately breaks user trust and triggers page exits.Vague validation errors: Serving ambiguous error messages like "invalid entry" without specifying exactly where or why the input failed causes user fatigue.Mobile Usability Roadblocks: Clunky user interfaces where the mobile keyboard completely blocks the input field or where tap targets are too tiny cause mobile users to abandon the form.Overwhelming Form Lengths: Deploying endless fields on a single page instead of migrating to a clean, multi-step progressive disclosure form architecture will heavily damage your conversion metrics.By monitoring these workflows via session capture, you can track exactly where users freeze, which input fields they repeatedly edit or erase, and use those insights to simplify your form pipelines.Uncovering True Navigation PathsThe clean, idealized user journey maps you design theoretically rarely line up with how actual humans interact with your live platform. User behavior recordings display your true, unedited navigation paths in plain sight.For example, while you might design a path expecting a user to advance straight from the homepage to check out, watching your session recordings might reveal that visitors consistently pause to hunt for your return policy page or read your team bio before checking out. This loop reveals a distinct trust deficiency or indicates that vital information is buried outside your primary conversion funnel. Isolating these detours during a UX audit delivers golden data insights to optimize your global site architecture.Essential Conversion Rate Optimization ToolkitsWhile the digital market offers numerous CRO tools, selecting a solution that matches your precise traffic volume and operational budget is a critical strategic decision. Consider these industry-leading alternatives:Tool NameCore SpecializationIdeal DeploymentHotjarAdvanced visual heatmaps and integrated user feedback widgets.An all-in-one suite optimized for SMBs and dedicated UX researchers.Microsoft ClarityFully free platform offering unlimited session capture volumes.Enterprise-level high-traffic sites running on tight budget constraints.FullStoryDeep technical telemetry, analytics data, and error logging.Large-scale enterprise systems, digital products, and complex SaaS architectures.Lucky OrangeNative live-chat integrations and real-time user stream monitoring.E-commerce websites looking to provide immediate, real-time checkout assistance.While Hotjar utilizes deep heatmap analysis to show where users focus their visual attention on a page, Microsoft Clarity shines due to its native Google Analytics integration and automated AI-driven insight modules. Regardless of the software you select, your primary focus must center on transforming raw playback observations into concrete operational actions.Maintaining Complete Privacy and GDPR ComplianceWhen deploying session recording scripts across your digital properties, data privacy compliance represents your most sensitive operational parameter. Protecting personally identifiable information (PII) is a strict legal requirement under regional privacy frameworks like GDPR and KVKK.To maintain an unassailable user recording strategy, apply these data governance rules:Aggressive Element Masking: Passwords, credit card entries, full names, and billing addresses must never be captured or stored on external servers. Premium toolkits like Hotjar and Clarity apply strict masking filters to input fields by default.IP Address Anonymization: Masking user IP addresses ensures that network locations remain decoupled from recorded on-site event sequences, preserving true user anonymity.Transparent Privacy Documentation: Explicitly state inside your global privacy policy that user recording tools are deployed on the site and state the precise analytics objectives behind the tracking.Data Retention Schedules: Avoid storing session data infinitely; clear your databases periodically after concluding specific optimization analysis sprints.A Step-by-Step Strategic CRO RoadmapReviewing recording playbacks without a framework yields little return. Use this step-by-step roadmap to drive user experience optimization across your platform:1. Isolate Lower-Performing Layouts: Review your quantitative analytics dashboard to catch pages with high exit rates or where checkout funnel drop-offs peak.2. Filter Your Playback Session Streams: Narrow down your recording streams to focus strictly on users who spent significant time on those specific pages but left without completing a macro conversion.3. Audit Behavioral Anomalies: Prioritize your review timeline around recording clips that contain verified rage clicks or dead clicks.4. Construct Clear Test Hypotheses: Map out concrete optimization statements, such as: "The unexpected shipping fee reveal on the final payment page triggers a psychological barrier that causes users to exit the checkout funnel."5. Execute and Measure Variations: Deploy your UI/UX design updates and review your fresh data streams via heatmap analysis and ongoing session recordings to validate performance uplifts.Conclusion: Transforming Telemetry into PerformanceSession recording solutions serve as the primary engineering engine driving professional UX analysis. Visually experiencing the silent friction your visitors endure, tracking down the core root of form abandonment, and flagging rage click behaviors grants your brand an incomparable competitive edge. However, long-term success requires a balance between strict adherence to Privacy/GDPR data masking guidelines and a relentless focus on translating playback telemetry into actionable site optimizations.If you are ready to lift your digital presence to the next tier and boost your conversion rates using verified scientific data methods, explore the expert user behavior analysis and specialized CRO capabilities of AnalyticaHouse. Let's replace product development guesswork with clean data to engineer the ultimate, frictionless experience for your users.
What is Retention Analysis? Data-Driven Ways to Retain Users
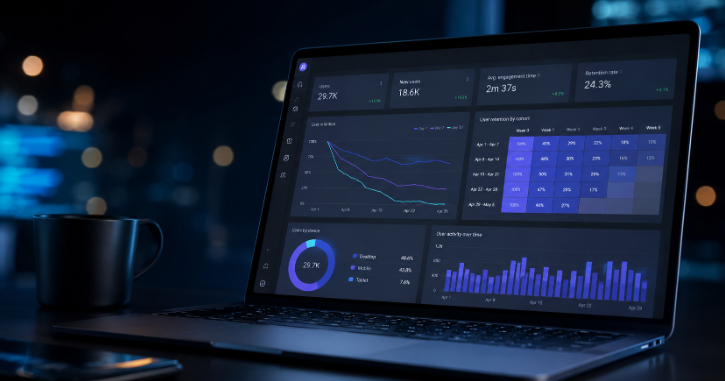
In the digital marketing ecosystem, the Customer Acquisition Cost (CAC) for a new user can be five to seven times higher than the cost of retaining an existing one. This striking statistic clearly highlights why growth-oriented brands must focus not just on driving traffic, but also on keeping existing users engaged within their systems. Retention analysis is one of the most critical data analysis methodologies available, allowing you to determine what percentage of people who start using your product or service remain loyal, and how many drop off along the way.In this guide prepared by AnalyticaHouse, we deep-dive into the concept of user retention, show how to leverage the power of product analytics tools, and evaluate data-driven strategies to boost your customer loyalty metrics.What is Retention Analysis? Core ConceptsIn its simplest terms, retention analysis is a process that measures the extent to which a specific cohort of users who started using your product in a given timeframe maintain this habit in subsequent periods. Through this analysis, you can pinpoint exactly where users disconnect from the product (churn) and identify which explicit features act as an "anchor" to keep them engaged within the system.Within modern marketing strategies, the real key to success is no longer just "how many users arrived," but rather "how many users stayed." Especially in the realms of SaaS analytics and mobile applications, a high retention rate is widely accepted as the strongest validation of Product-Market Fit.Why You Must Focus on Retention Analysis:Sustainable Growth: While new user acquisition yields linear growth, high retention rates trigger a multiplier effect that drives compounded business growth.Cost Efficiency: Retaining existing users is significantly more economical than constantly deploying fresh advertising budgets to chase new audiences.Maximizing Lifetime Value (LTV): The longer you retain a user within your ecosystem, the higher the total cumulative revenue generated from that individual becomes.Data-Driven Product Development: Identifying which features inject genuine value allows you to shape your product roadmap securely based on verified user behavior data.The Key to Measuring Customer Loyalty: Cohort AnalysisOne of the most powerful methodologies that makes retention analysis truly meaningful is cohort analysis. A cohort refers to a group of users who share a common characteristic. Typically, this segmentation is established based on the specific time a group of users registered on your app or completed their initial purchase.Cohort analysis enables you to monitor user behaviors over time in distinct "waves." For instance, by comparing the retention patterns of users acquired in January against the behavioral configurations of those who joined in February or March, you can directly evaluate the exact impact of product updates or marketing campaigns launched during those specific timeframes.Example of a Structured Cohort Analysis TableThe matrix below illustrates weekly user retention rates for a standard mobile application:Registration WeekNew User VolumeWeek 1 (%)Week 2 (%)Week 3 (%)Week 4 (%)January 1–71,00045%30%25%20%January 8–141,20048%35%28%22%January 15–211,10050%38%30%25%When analyzing this data, we observe that the Week 1 retention rate scales up gradually with each consecutive week. This upward movement proves that the iterative optimizations applied to your user onboarding flow or the initial product experience are successfully yielding positive business results.Why the "First 7 Days" Lifecycle is VitalThe long-term trajectory of a user's relationship with your product is generally decided within the first 7 days. This narrow window represents the most critical threshold where a user must experience the "Aha Moment"—the exact instance where they grasp the true, functional value of your product.User behavior data indicates that more than 80% of users who remain inactive during their first 7 days never return to the platform. Consequently, you must aggressively prioritize the following elements within your initial 7-day lifecycle strategy:Frictionless Onboarding: Present the core benefit of the product in the fastest, simplest way possible without overwhelming the user with complex, non-essential details.Instant Micro Wins: Guide the user to complete a small milestone within their first 24 hours (e.g., uploading their initial file or completing their profile data).Educational Contextual Content: Serve brief interactive tips and guided onboarding tooltips showing how to navigate the system at peak efficiencies.Triggering Key Retention Behaviors: Run advanced data analysis to isolate which specific features your historically loyal power users interacted with during their first week, and programmatically guide new signups directly toward those exact activation loops.Churn Analysis: Diagnosing Why Users LeaveOn the flip side of the retention coin sits churn analysis. Churn represents the baseline rate at which active users stop interacting with your product entirely. Without diagnosing exactly why users drop out of your platform, mapping a strategy to retain them is impossible. When executing a comprehensive churn analysis, you must investigate these core questions:At which precise step or following which explicit interaction do users drop out in bulk?Is there a shared behavioral anomaly among churned users (e.g., completely omitting a visit to a vital sub-page)?Which paid marketing acquisition channels yield the highest volume of churned users?How heavily do technical bugs, sluggish load times, or clunky UX workflows drive up your baseline churn metrics?Segmenting your audiences during a churn audit makes it significantly easier to pinpoint the source of friction. For instance, if you discover that drop-offs concentrate strictly among users running a specific operating system version, it alerts your engineering team directly to a clear technical optimization bug.Driving Re-Engagement: Push Notifications and Email MarketingBuilding a stellar product is only half the battle; to safeguard long-term retention, you must execute a proactive communication strategy. Push notifications and automated email marketing serve as your most potent reminders to draw users back into your active ecosystem.1. Push Notification StrategiesWhen structured correctly, mobile application push notifications can drive up retention rates by as much as 20%. However, you must keep in mind that generic, spam-heavy notifications will frustrate users, prompting them to mute alerts or uninstall your application entirely. Highly personalized notifications tied directly to historical behaviors (such as abandoned cart notifications or targeted alerts like "Fresh content matching your interests has dropped") consistently capture superior conversion returns.2. Email Win-Back LifecyclesFor SaaS platforms, email remains the primary lifecycle channel to educate users and re-ignite fading engagement. Setting up automated workflows that trigger targeted feature announcements or tailored product guides whenever a user remains inactive for a specific timeframe plays a critical role in building customer loyalty.Sector Mapping: SaaS vs. Mobile ApplicationsRetention strategies pivot on distinctly unique dynamics depending on your underlying business model. Consider these data-driven approaches across the two core digital sectors:1. SaaS Analytics and RetentionIn SaaS (Software as a Service) frameworks, retention is tied directly to the continuity of Monthly Recurring Revenue (MRR) or Annual Recurring Revenue (ARR) subscription tiers. The strongest loyalty indicator for a SaaS platform is deep operational integration. If a user embeds their daily business workflows into your platform, their likelihood of churning plummets. Therefore, building open API integrations and seamless data import modules directly anchors your retention metrics.2. Mobile App Retention TrackingWithin mobile applications (spanning gaming, e-commerce, and social media), your baseline tracking metrics focus heavily on the ratio of Daily Active Users (DAU) to Monthly Active Users (MAU). While mobile gaming applications leverage daily reward mechanics to maximize app stickiness, e-commerce applications focus heavily on personalized, time-sensitive incentives and structured loyalty programs.Essential Toolkits for In-Depth Retention AnalysisTo refine raw event streams into clear product retention strategies, you must deploy advanced product analytics toolkits. Professional data teams frequently rely on these core platforms:Amplitude: The industry pioneer for tracking behavioral cohorts, mapping user paths, and running granular retention deep-dives.Mixpanel: Highly effective for monitoring real-time step streams, creating interactive funnels, and predicting user churn trends.Google Analytics 4 (GA4): Delivers highly capable out-of-the-box user retention templates powered by its native event-based data schema.Adjust / AppsFlyer: Premium mobile attribution tools that map paid acquisition sources directly to long-term post-install retention data, providing a holistic view of campaign ROI.Conclusion: Engineering Data-Driven LoyaltyRetention analysis is not a static checklist you review once and archive; it is a living, continuous cycle that demands routine iteration. To fully understand why your users stay and why they leave, you must run regular cohort analyses, optimize the high-friction milestones of the initial 7-day lifecycle, and sustain active communication via smart push notification and email workflows.Ultimately, the most successful marketing asset you can build is a frictionless product that delivers undeniable, everyday value to your users. At AnalyticaHouse, we empower brands to scale their business securely through data-driven performance architectures. If you are ready to know your users deeply and optimize your retention rate metrics, explore our analytical solutions to launch your growth journey today.

How to Create Professional Reports with Looker Studio
In the digital marketing ecosystem, reading data accurately carries a much deeper meaning than just looking at numbers. Today, data visualization processes sit right at the center of strategic decision-making mechanisms. Looker Studio, formerly known as Google Data Studio, is one of the most powerful data analysis tools available to transform complex data sets into clear, interactive, and professional dashboards. In this guide prepared with AnalyticaHouse expertise, we break down how you can transform a performance report into a strategic asset and generate genuine value for your business.What is Looker Studio and Why Should You Use It?Looker Studio is a cloud-based business intelligence tool provided by Google that allows you to consolidate data from various origins into a unified panel. Especially within digital reporting workflows, the flexibility it provides eliminates the manual data-entry errors and severe time losses caused by legacy Excel spreadsheets. Looker Studio's reporting capabilities do not just visualize data; they actively assist you in discovering hidden correlations between distinct data sets.Rich Data Connectors: You can link directly to hundreds of different platforms, including Google Ads, GA4 dashboards, Search Console, Facebook Ads, and BigQuery.Accessibility: You gain access to a powerful data infrastructure to build enterprise-grade performance reports without paying high licensing fees.Real-Time Data Streams: Your data refreshes automatically, enabling you to trace the most up-to-date metrics and execute instant, agile decisions.Customizable Design: You can implement custom color palettes and corporate logos to craft reports that flawlessly match your brand identity.The Foundations of a Professional Report: The Planning PhaseBefore diving straight into the tool and building random charts, you must clarify your target audience and define the precise business questions the report needs to answer. Consider these three foundational pillars during an analytics dashboard project:Target Audience: Will the dashboard be evaluated by an internal SEO specialist or the CEO? Structure your data granularity accordingly.KPI Definition: Define which specific performance metrics benchmark success for your project (e.g., ROAS, Conversion Rate, Organic Traffic).Data Integrity: Verify that your underlying data streams (such as GA4) are configured correctly and that the data flows seamlessly without errors.Advanced Analysis via Data BlendingOne of Looker Studio's most impressive features is "Data Blending," which allows you to merge disparate data sources across a shared join key. For example, you can blend your advertising spend from Google Ads with corresponding revenue metrics from GA4 to view them side-by-side in a single table.Strategic Data Blending Scenarios:Omnichannel Marketing Matrix: Combine spend data from Facebook Ads and Google Ads to automatically calculate your true cross-channel "Cost per Lead" (CPL).Sales and Inventory Integration: Blend CRM backend databases with Google Analytics to rapidly identify which high-volume product pages are generating clicks but suffer from out-of-stock statuses.Budget Tracking Dashboards: Match target goals mapped inside Google Sheets against your live ad spend to keep budget utilization completely optimized.Professional Tip: Pay close attention to your "Join Key" configurations. When blending data sources, ensure you link them using fields that match perfectly in both sets, such as "Date" or "Campaign Name".Merging GA4 and Search Console: Building a High-Performance SEO DashboardThe key to a comprehensive SEO dashboard is bridging user behavior before they arrive at your site (Search Console) with the exact actions they take after landing on your pages (GA4). This holistic perspective reveals which organic keywords generate actual bottom-line revenue rather than just vanity traffic clicks.Step-by-Step Integration Map:Open a blank report in Looker Studio and add Google Search Console as your initial data source.Click "Add Data" and connect your primary GA4 dashboard property.Open the "Blend Data" workspace, placing Search Console on the left and GA4 on the right.Set "Landing Page" as your unified Join Key.This setup allows you to analyze organic search impressions and ranking data right next to conversion metrics on the exact same row.SEO Performance Dashboard MatrixMetric TypeData SourcePriority LevelStrategic PurposeImpressions & ClicksSearch ConsoleHighTracks your overall visibility share in SERPs.Average PositionSearch ConsoleMediumMonitors broad organic ranking movements and keyword trends.Session DurationGA4HighEvaluates on-page user experience and content quality.Conversion RateGA4CriticalMeasures the concrete commercial value driven by SEO.Driving Efficiency Through Automated Reporting ProcessesThe ultimate goal of reporting is not merely collecting data, but extracting rapid, accurate insights to drive business growth. Automating your digital reporting pipelines prevents your marketing teams from wasting valuable hours manually copying data every week. Looker Studio streamlines this workflow natively through its "Scheduled Email" features.Automation Best Practices:Email Delivery Scheduling: Program the platform to automatically distribute your primary dashboard directly to key stakeholders as a PDF every Monday morning.Dynamic Date Range Controls: Lock your reporting charts to rolling parameters like "Last 30 days" or "This month" so the dashboard is instantly up-to-date upon opening.Interactive Filtering Components: Embed dynamic date pickers and channel dropdown filters, allowing viewers to easily slice the data and interrogate metrics independently.Executive Presentation Logic: Storytelling with DataExecutives and clients rarely want to comb through thousands of lines of raw data spreadsheets. An executive-ready performance report must be built on a clear narrative framework: What happened, why did it happen, and what explicit actions are we executing next?Executive Dashboard Design ArchitectureIn a professional dashboard layout, always position high-level "Scorecards" right at the top of the viewport. These scorecards must showcase your 3 to 4 most vital core KPIs (such as Total Revenue, ROAS, and CPA) using large, easily readable text. Directly beneath, embed clean trendlines to illustrate performance trajectories compared to previous periods at a single glance.Map your presentation across three logical layers:Top Layer (Executive Summary): A high-level overview of global performance and goal completion metrics.Middle Layer (Channel Breakdown): Medium-level performance tracking segmented by specific channels (e.g., Google Ads vs. Paid Social).Bottom Layer (Granular Insights): Deep technical data paired with strategic action plans for the upcoming month.Looker Studio's Standings Among Core BI PlatformsWhile enterprise platforms like Power BI and Tableau deliver extensive analytical computing power, Looker Studio’s seamless, out-of-the-box integration with the Google marketing stack makes it uniquely indispensable for digital marketers. At AnalyticaHouse, we position this tool at a strategic junction to guarantee complete data transparency and provide real-time business insights.BI Tool Comparison OverviewFeatureLooker StudioPower BITableauLearning CurveFast and intuitive.Demanding steep training.Requires advanced data expertise.Google Stack IntegrationNative and flawless.Limited capability.Moderate capability.Licensing CostFree (With paid Pro tiers).License-based pricing.High enterprise costs.Sharing SimplicityVery practical (Via direct web links).Requires internal corporate infrastructure.Strict per-user license requirements.Conclusion: Construct a Data-Driven FutureExecuting professional reporting with Looker Studio represents more than a baseline technical skill; it proves how deeply you analyze your underlying business operations. From deploying initial GA4 dashboards to building multi-layered data blending models, you must focus intently on the narrative your metrics whisper. A properly structured performance report safeguards your marketing capital, exposes failing strategies early, and illuminates fresh growth opportunities.If you are ready to make your data arrays meaningful, moving away from complex, chaotic reporting rows to focus on high-fidelity insights, leverage the advanced data analytics capabilities of AnalyticaHouse. Remember, you cannot manage what you do not accurately measure; but with strategic data visualization, you can optimize, scale, and grow every facet of your business.

What is a KPI? Which Metrics Should Companies Track?
We all recognize the immense value of data in the modern business world. However, raw data remains a heavy burden for a ship that has lost its course unless it is properly processed and rendered meaningful. The foundational tools that allow you to understand how close your company is to reaching its strategic goals are KPIs (Key Performance Indicators), or Key Performance Metrics. Tracking the right metrics does not just measure your current success; it actively steers your future growth strategies.In this guide, prepared by AnalyticaHouse, we deep-dive into the concept of KPIs while sharing how to leverage the power of data analysis through industry-specific examples and how to safeguard your business against the frequently encountered trap of vanity metrics.What is a KPI? Definition and Strategic ImportanceA KPI (Key Performance Indicator) is a quantifiable metric that evaluates the performance of an organization, a specific department, or an individual employee in achieving distinct objectives. Placing KPIs at the center of your data analysis workflows transforms complex data streams into manageable, highly actionable insights. The most crucial point to remember here is that not every single metric qualifies as a KPI; a data point only acts as a KPI if it links directly to a strategic corporate objective.Establishing an effective KPI architecture forms the bedrock of your data-driven decision-making culture. By monitoring performance in real-time, you gain clear visibility into which specific business areas require scaling, which investments are yielding financial returns, and which active processes are dragging down operational efficiency. Securing professional analytics consulting is critical at this stage to guarantee your business goals map correctly and your tracking toolkits are structured without errors.The Risk of Misaligned MetricsThe most prevalent mistake committed during the KPI selection phase is attempting to measure everything simultaneously or fixating on easily retrievable data fields that fail to inject genuine business value. A poorly selected KPI can misdirect your teams' energy into inefficient areas. For example, if you evaluate a sales department exclusively on "the total volume of placed calls," your team members may shift their focus away from generating revenue to chase low-quality leads simply to inflate call counts. Therefore, when designing performance metrics, you must relentlessly evaluate whether the data directly serves your business's ultimate bottom-line success.Deconstructing Vanity Metrics: Do Not Mask Real PerformanceIn the realms of digital marketing and business analytics, one of the most sensitive items you must guard against is vanity metrics. These data points look phenomenal on paper and flatter your ego, but they do not actively contribute to your net profitability or sustainable growth trajectory.Total App Downloads: If users download your mobile application but never open it or delete it instantly, this figure is a total illusion. Instead, focus your tracking on Active Users (DAU/MAU).Social Media Likes: While likes serve as an indicator for broad brand awareness, they lack financial weight unless backed by a corresponding conversion rate.Raw Page Views: Accumulating millions of views on a website yields no strategic value if your visitors bounce rapidly and demonstrate zero meaningful on-site engagement.To capture real commercial success, you must focus heavily on "Actionable Metrics". These metrics deliver definitive answers to the question: "What explicitly do I need to modify?"Industry-Specific KPI BlueprintsEvery industry operates under its own distinct rules; consequently, your chosen performance metrics must be fully customized to fit your unique business model. The table below breaks down critical KPIs across three core sectors:SectorCritical KPIMetric DescriptionE-CommerceConversion RateThe percentage of web visitors who successfully complete a purchase.E-CommerceAverage Order Value (AOV)The average financial amount spent by customers per separate order.SaaS (Software)Monthly Recurring Revenue (MRR)The predictable monthly income generated through your subscription tiers.SaaS (Software)Churn RateThe baseline percentage of subscribers who cancel their accounts over a given period.Media / PublishingAverage Time on PageA core stickiness metric showing how engaging your content is to visitors.Media / PublishingAd ViewabilityThe percentage of served ad impressions that are genuinely seen by active users.Department-Level KPI BlueprintsTo reach your overarching corporate vision, every internal department must rigorously manage its own micro-KPIs. You can leverage the following frameworks when running department-level data analysis:1. Marketing Department KPIsYour marketing teams must focus their metrics on digital performance measurement and brand engagement:ROAS (Return on Ad Spend): The exact revenue generated for every dollar deployed into paid media campaigns.CPA (Cost Per Acquisition): The net financial cost required to acquire a single new customer or qualified lead.MQL (Marketing Qualified Leads): The total volume of high-intent prospects captured explicitly through marketing operations.2. Sales Department KPIsSpeed and transactional efficiency sit front and center for sales operations:Sales Cycle Length: The average duration of time it takes for a prospect to advance from initial contact to a completed sale.Win Rate: The total percentage of sent business proposals or quotes that successfully close as won sales.Customer Lifetime Value (LTV): The projected total revenue an individual customer will generate throughout their active lifecycle with your firm.3. Customer Success KPIsMaximizing retention is the absolute engine driving your long-term organic growth:Net Promoter Score (NPS): The baseline index measuring your customers' natural willingness to recommend your brand to others.First Response Time (FRT): The average duration of time it takes for an agent to respond to an open support request.Retention Rate: The exact percentage of existing customers your business successfully retains over a specific timeframe.Digital Performance Tracking and User AnalyticsIn contemporary business analytics workflows, mapping your visitors' digital footprints forms the most valuable link in your strategic chain. User analytics enables you to observe how a visitor behaves from the second they land on your platform, which sub-pages capture their focus, where they stall, and why they pull out without checking out.When executing conversion rate optimization (CRO), looking solely at how many people completed a purchase is insufficient; you must focus intensely on why the remaining users chose not to buy. Methods like heatmaps, session recordings, and structured funnel analysis offer unparalleled qualitative insights during a data-driven decision-making process.The Role of Business Intelligence and Analytics ConsultingWhile many enterprises collect massive quantities of data, transforming that data into a strategic competitive advantage requires deep technical specialization. Business analytics aims to evaluate historical metrics to accurately model and forecast future market trends (Predictive Analytics). Establishing the correct underlying data technology stack (GA4, BigQuery, Tableau, etc.) and maintaining clean data processing pipelines is absolutely vital across this workflow.Partnering with expert analytics consulting services gives your business definitive advantages:Ensuring your active KPI sets map in flawless alignment with your overarching business targets.Condensing complex multi-layered data arrays into simplified, automated executive dashboards.Eradicating structural tracking errors and keeping data clean and free of noise.Uncovering high-fidelity insights that systematically maximize your media Return on Investment (ROI).Conclusion: Construct Your Growth on Measured MetricsThe answer to what a KPI is goes far beyond a dry technical measurement unit; KPIs function as the literal road signs pointing toward your corporate vision. Isolating actionable metrics, avoiding the allure of vanity indicators, and running rigorous department-level analysis will position your brand multiple steps ahead of the competition. Data analysis is not a one-and-done project; it is a living cycle that must be continuously fueled and optimized.If you are ready to maximize your digital performance, draw deep insights from user behavior, and establish robust data-driven decision-making frameworks, explore the specialized capabilities of AnalyticaHouse. Let’s align your data with the right strategy to accelerate your business's growth journey.